
Fig. 5. Distribution of 4DTv distances.
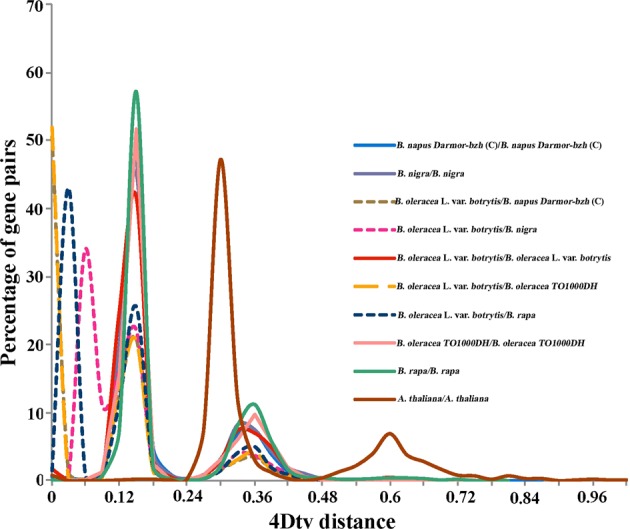
The x axis indicates the 4Dtv distance. The y axis indicates the percentage of gene pairs. (C) shows the C subgenome of B. napus Darmor-bzh
Official websites use .gov
A
.gov website belongs to an official
government organization in the United States.
Secure .gov websites use HTTPS
A lock (
) or https:// means you've safely
connected to the .gov website. Share sensitive
information only on official, secure websites.
The x axis indicates the 4Dtv distance. The y axis indicates the percentage of gene pairs. (C) shows the C subgenome of B. napus Darmor-bzh