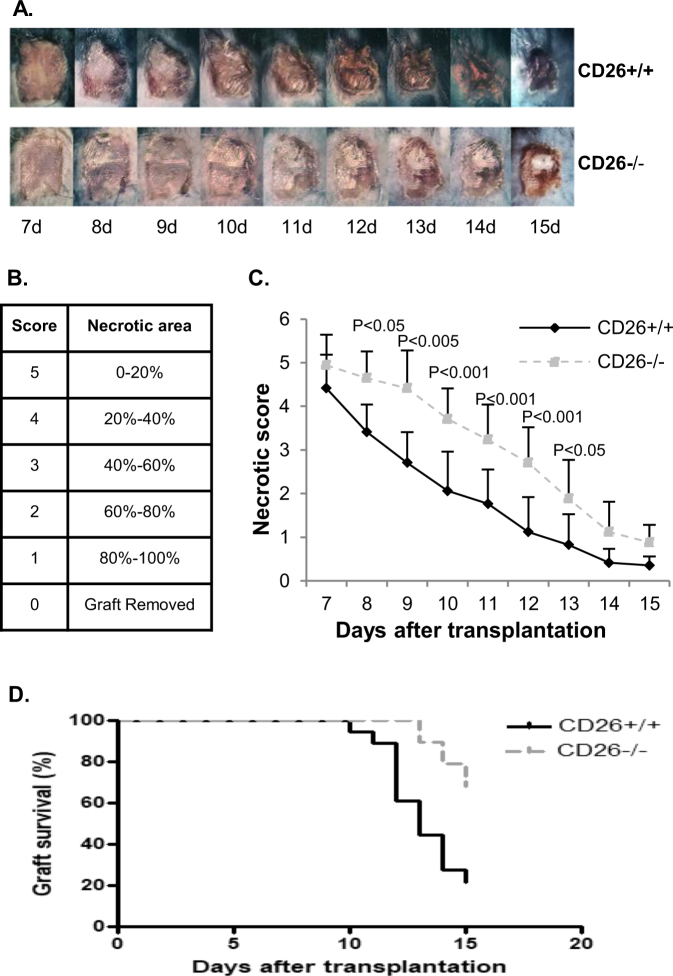
Fig. 1. Allograft rejection of CD26+/+ and CD26–/– mice.
a Skin allograft appearance of CD26+/+ (upper panel) and CD26–/– mice (lower panel) from day 7 to 15 posttransplantation. c Statistical analysis of the necrotic levels of grafts from day 7 to day 15 posttransplantation. b Different score levels indicate different necrotic areas of the mice skin allograft. d The graft survival rate in CD26+/+ and CD26–/– mice within 15 days posttransplantation. The values in c and d represent the mean values ± SD of at least 17 mice at each time point. The data were analyzed with GraphPad 6; p-values were calculated with a Chi-square test

