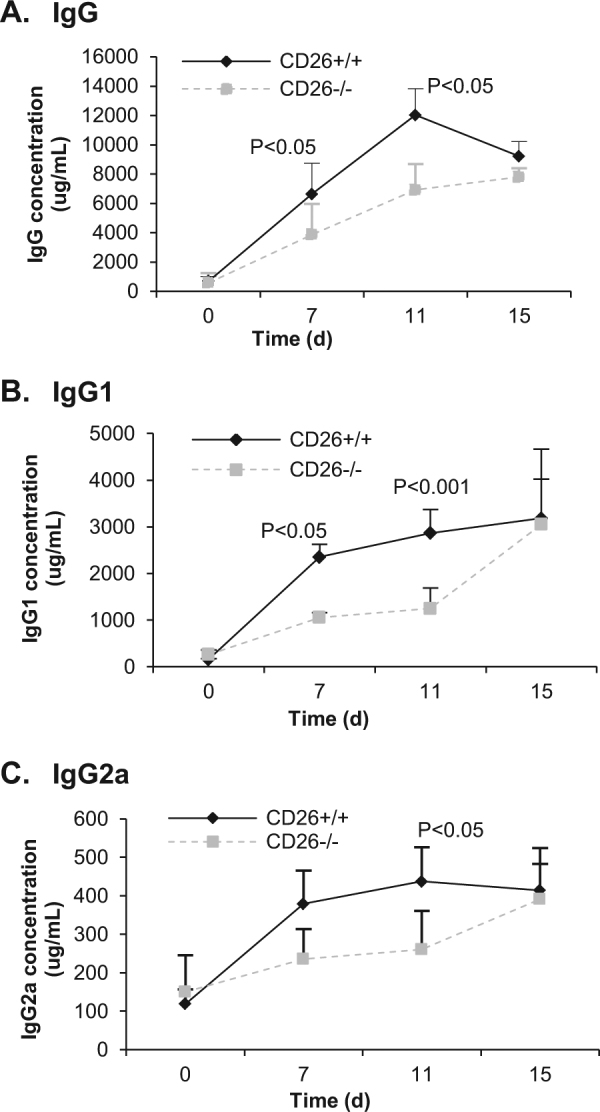
Fig. 2. Levels of IgG, IgG1, and IgG2a in the serum of mice after skin transplantation.

Blood was taken at the indicated time points after skin transplantation (day 0 represents the day before transplantation). Serum concentrations of a IgG, b IgG1, and c IgG2a were measured by ELISA. Values represent the means ± SD of at least eight mice at each time point.
