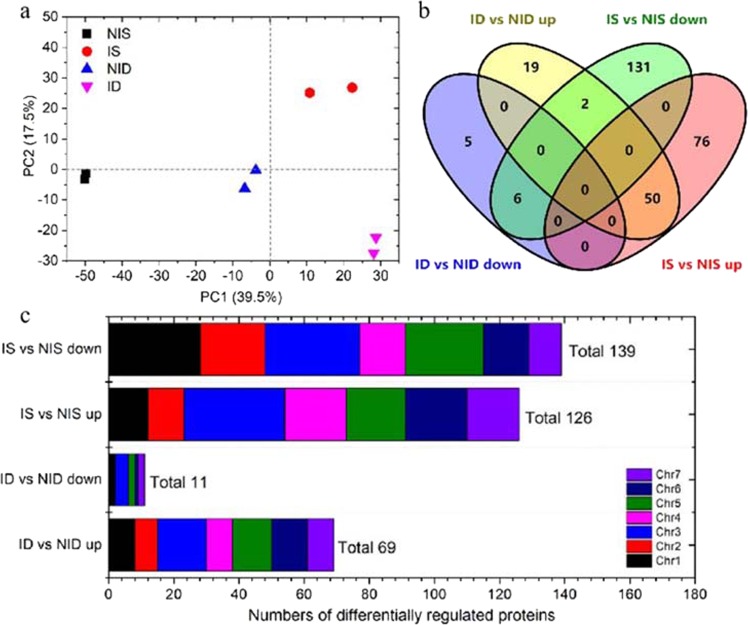
Fig. 2. Expression patterns of differentially regulated proteins (DRPs).
a Principal component analysis (PCA) of the iTRAQ data. Each point in the PCA graph represents the whole-protein profile of one biological replicate. Numbers in parentheses on the axes represent the percentage of total variance explained by each principal component. b Venn-diagram of the distribution of DRPs. c Distribution of DRPs on each chromosome (Chr) of cucumber. ID: PM-inoculated D8 leaves; NID: noninoculated D8 control leaves; IS: PM-inoculated SSL508-28 leaves; NIS: noninoculated SSL508-28 control leaves. “ID vs. NID up” represents those DRPs with higher expression in D8 leaves at 48 h after infection with PM when compared with mock-inoculated D8 leaves; “ID vs. NID down” represents those DRPs with lower expression in D8 leaves at 48 h after infection with PM when compared with mock-inoculated D8 leaves. “IS vs. NIS up” represents those DRPs with higher expression in SSL508-28 leaves at 48 h after infection with PM when compared with mock-inoculated SSL508-28 leaves; “IS vs. NIS down” represents those DRPs with lower expression in SSL508-28 leaves at 48 h after infection with PM when compared with mock-inoculated SSL508-28 leaves

