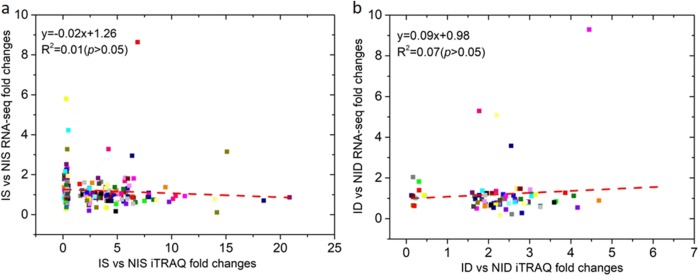
Fig. 4. Correlation analysis of protein abundance changes (x-axis) measured by iTRAQ and the corresponding gene expression changes measured by RNA-seq (y-axis).
a Comparison of IS vs. NIS, comparing PM-inoculated SSL508-28 (IS) leaves with noninoculated SSL508-28 (NIS) control leaves 48 h after PM inoculation; b Comparison of ID vs. NID, comparing PM-inoculated D8 (ID) leaves and noninoculated D8 (NID) control leaves 48 h after PM inoculation

