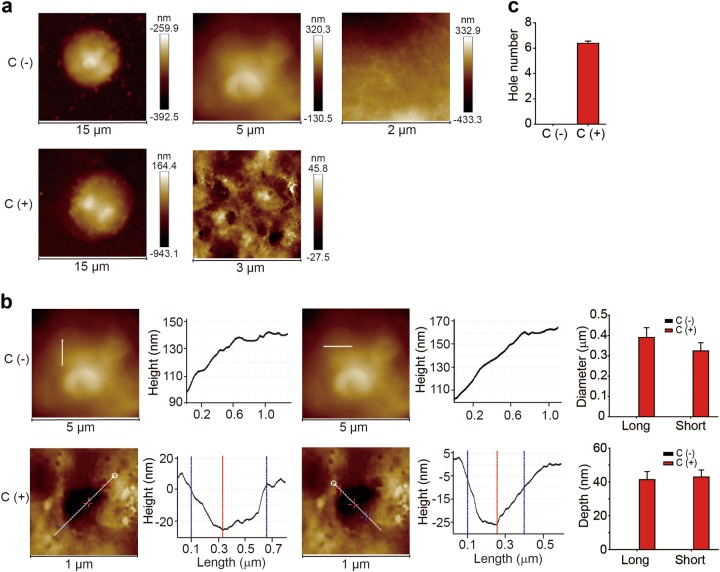
Fig. 6.
Characterization of complement-induced pore formation. After culture with IL-2 (100 U/ml) for 4 h, splenic CD4+CD25+ Treg cells were treated with an anti-CD25-depleting antibody (PC-61) or the isotype control in the presence of C57BL/6 mouse serum for 30 min. a Representative images of the AFM topographies of the outer plasma membrane of Treg cells. b, c The pore diameter and depth were measured (b). The pore number was calculated by analyzing three 5 × 5 μm2 areas from one cell (n = 6) (c)

