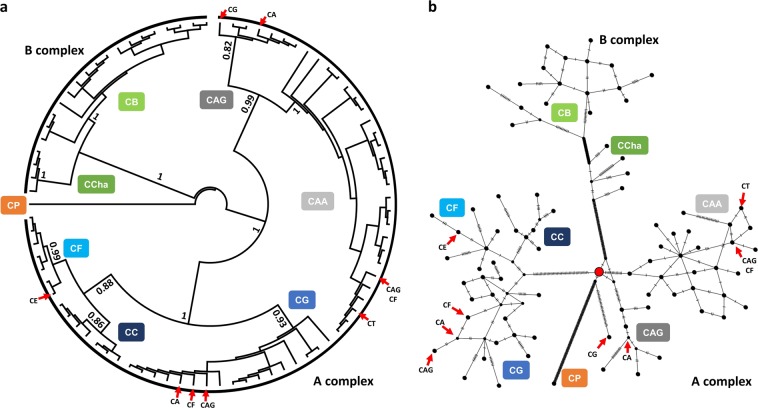
Fig. 2.
Phylogenomic analysis of the 85 haplotypes based on (a) BI methods and (b) a minimum spanning network. For both parts of the figure, CP was used as an outgroup/root; each species is a separate clade from other species. The A complex is formed by CAA, CAG, CC, CF, and CG, where the phylogenetic signal is equal between the BI tree and the network for the CC, CF, and CG species. The B complex is formed by CCha and CB, while it clearly resolved the position of CCha in between the CB and the A complex species. The red node represents the most common ancestral connection among the groups

