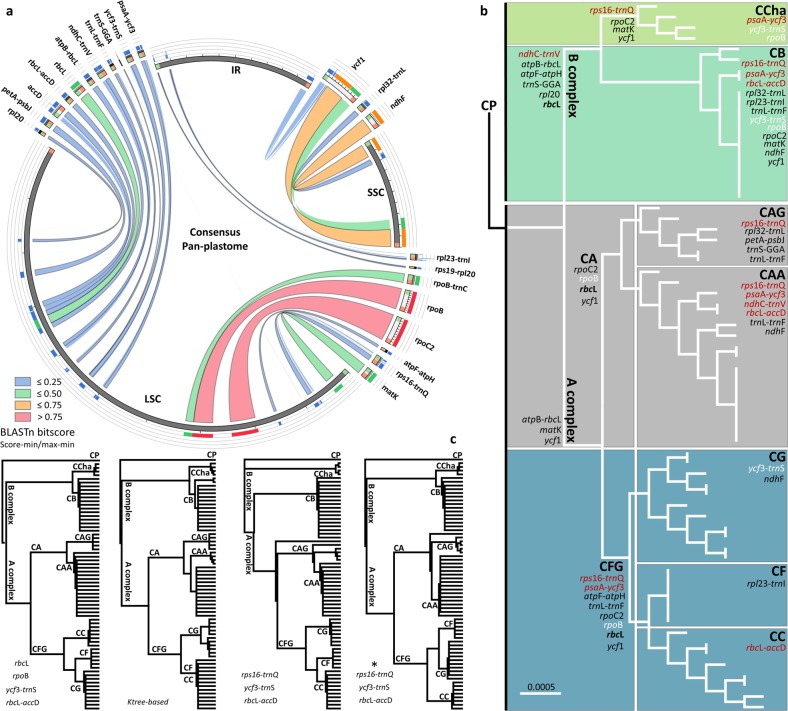
Fig. 5. In silico validation of the hypervariable loci.
a Hypervariability based on BLAST is shown in the Circos plot. The loci positions in the SSC, LSC and/or IR regions are shown; the line reflects the region size, and the color is based on the BLASTn score (less similar: <0.25 to the very similar: >0.75). b Maximum likelihood (ML)-based phylogenetic analysis for each hypervariable locus is indicated on the complete set tree shown in Fig. 2a based on clustering match. Loci with intraspecific variation are indicated in red, strong candidates from the current study are indicated in white, and strong candidates from the literature are indicated in bold. c The final ML trees produced from the tested combinations to retrieve the complete set of phylogenetic signals are shown. Trees from left to right are the visual-based tree, Ktree-based tree, loci with interspecific variation (InDels included) and the latter set when InDels are excluded (*)

