Figure 3.

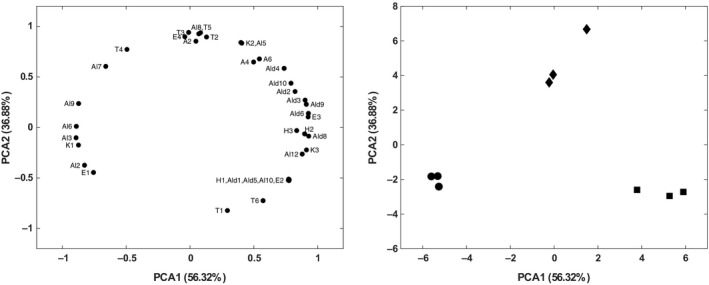
2D‐PCA plots of the VOCs profiles of the three EVOOs. The loadings (left) and the three (scaled) samples of Ogliarola (■), Ravece (♦), and Ruvea antica (●) in the transformed space (right)

2D‐PCA plots of the VOCs profiles of the three EVOOs. The loadings (left) and the three (scaled) samples of Ogliarola (■), Ravece (♦), and Ruvea antica (●) in the transformed space (right)