Fig. 1.
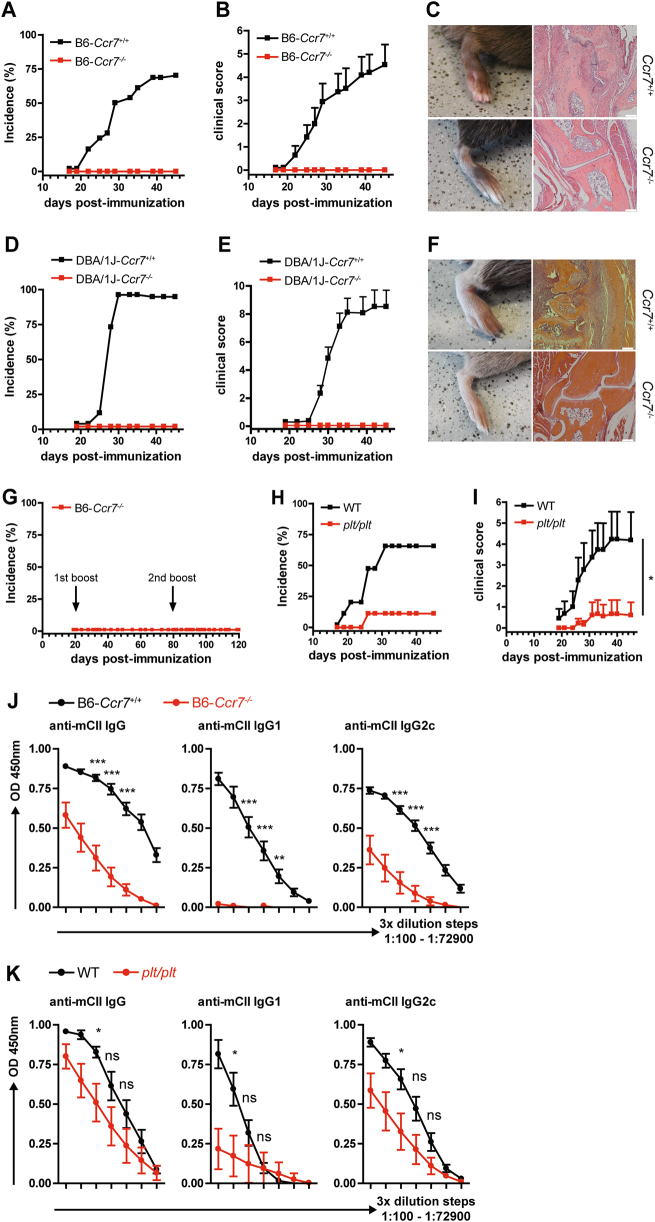
Ccr7−/− mice are resistant to CIA. Incidence (a) and clinical score (b) of CIA in Ccr7-deficient mice on a C57BL/6 background. The results are shown from ≥12 mice per group. The data in (b) are the mean ± SEM. c Representative pictures of CIA manifestation (left) and joint histopathology (right) in B6 WT and B6-Ccr7−/− mice. d Incidence and (e) clinical score of CIA in Ccr7-deficient mice on a DBA/1J background. The results are shown from ≥10 mice per group. f Representative pictures of CIA manifestation (left) and joint histopathology (right) in DBA/1 J WT and DBA/1J-Ccr7−/− mice. g Incidence of prolonged CIA in B6-Ccr7−/− mice. Mice were boosted on day 21 and on day 80 post-initial immunization and monitored until day 120. Results are shown from 12 mice. h Incidence and clinical score (i) of CIA in plt/plt mice. The results are shown from 9–11 mice per group. Areas under the curve (AUC) calculated from the CIA scores were compared for statistical significance (Student’s t-test) *P < 0.05; Levels of anti-murine-CII Ab levels were measured by ELISA in serially diluted serum samples from B6-Ccr7−/− mice (j) and plt/plt mice (k) upon CIA induction (3-fold dilution steps, 1:100–1:72900). The results are shown from n = 6–8 mice per group. The data are presented as the mean ± SEM. *P < 0.05, **P < 0.01, ***P < 0.001

