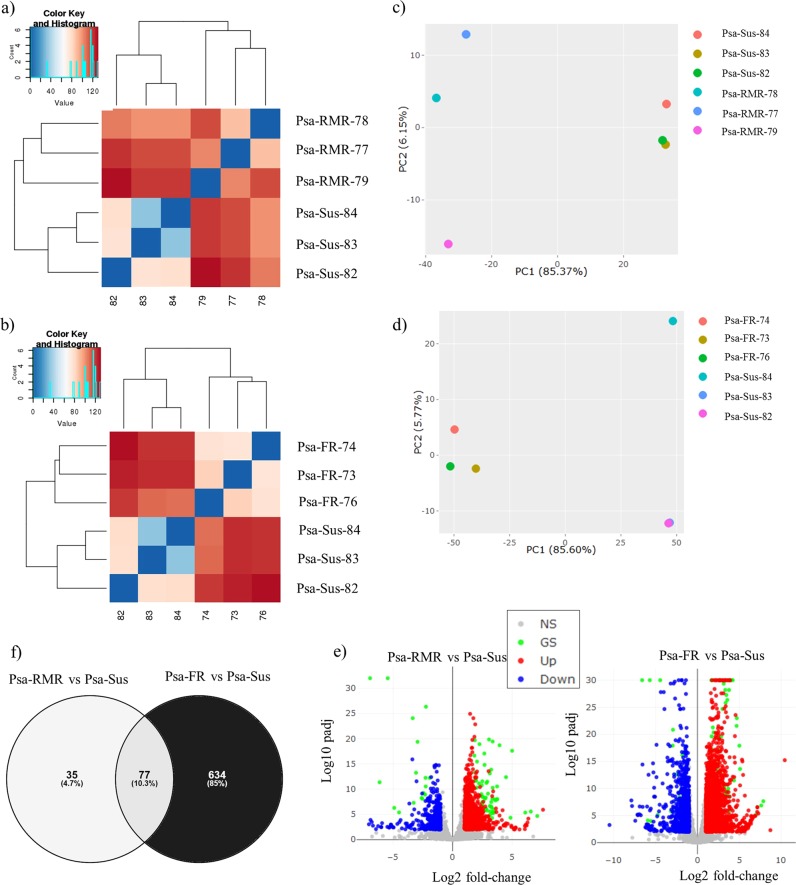
Fig. 4. RNA-seq analysis of F1 ‘Hort16A’ × P1 genotypes, exhibiting resistance or susceptibility to Psa in the field.
RNA-seq was performed on young healthy leaf tissues of field-grown plants belonging to three groups based on relative resistance/susceptibility. The first group included three relatively Psa-resistant plants (Resistant to medium resistant /Psa-RMR). The second group included three fully Psa-susceptible genotypes, including ‘Hort16A’ (Psa-Sus) and had been exposed to the natural levels of Psa infection in field for 2 years. The third group represents the three most resistant genotypes over 4 years in the field (Psa-FR). All genotypes were from the QTL mapping study (see Methods). a and b show heat-maps for the genome-wide differential expression (DE) analysis in Psa-RMR vs. Psa-Sus and Psa-FR vs. Psa-Sus, respectively. c and d are plots of Principal component analysis for the DE in Psa-RMR vs. Psa-Sus and Psa-FR vs. Psa-Sus, respectively. e shows volcano plots for the DE, with significantly (Log10 adjusted p-value (padj), Log2 fold-change) upregulated and downregulated genes highlighted in red and blue respectively in the two comparisons, Psa-RMR vs. Psa-Sus and Psa-FR vs. Psa-Sus. The gray dots indicate non-significantly expressed genes, whereas the green dots highlight the genes that are differentially expressed in common between Psa-RMR vs. Psa-Sus and Psa-FR vs. Psa-Sus. f shows the DE genes in common or unique, respectively, between Psa-RMR vs. Psa-Sus and Psa-FR vs. Psa-Sus

