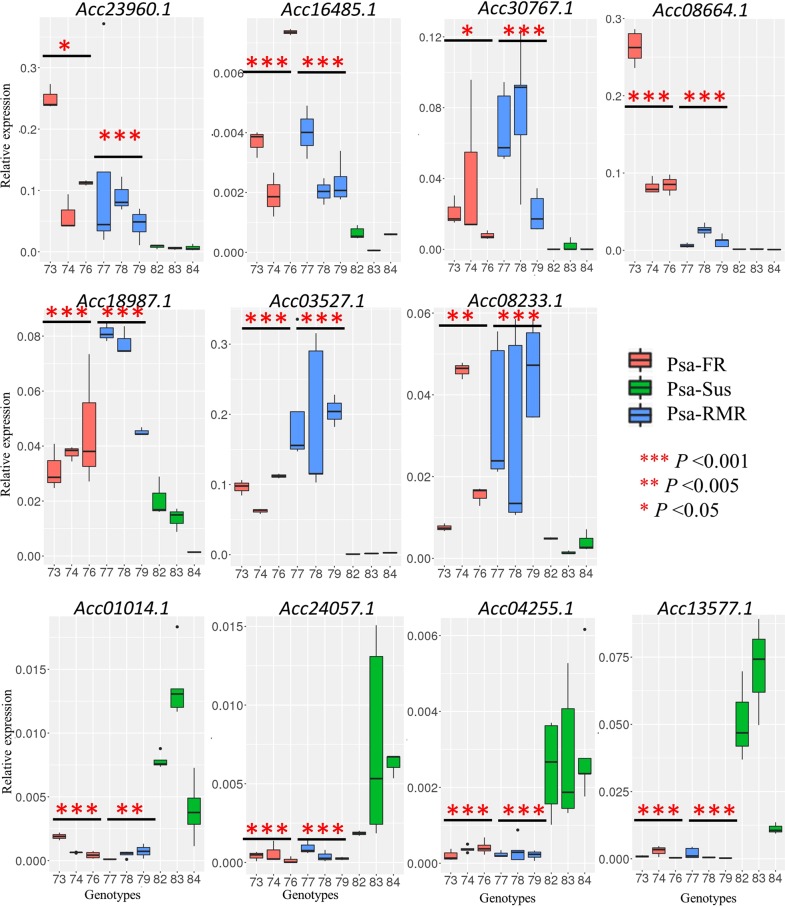
Fig. 5. Real-time quantitative PCR of relative gene expression of candidate genes in Psa-RMR, Psa-FR, and Psa-Sus genotypes.
Expression of the candidate genes was analyzed in three individual field grown genotypes from the three groups, Psa-RMR (73, 74, 76), Psa-FR (77, 78, 79) and Psa-Sus (82, 83, 84), using real-time quantitative reverse transcription polymerase chain reaction (RT-qRT-PCR). Data represents the mean of relative gene expression of the candidate genes in three replicates of each genotype, after normalizing to the global mean expression of the two-housekeeping genes, Actin and Ubiquitin, within each replicate. Asterisks represent statistically significant differences in the mean relative expression of the candidate genes in genotypes of Psa-RMR and Psa-FR compared with the mean relative expression of genes in Psa-Sus genotypes using Student’s t-test

