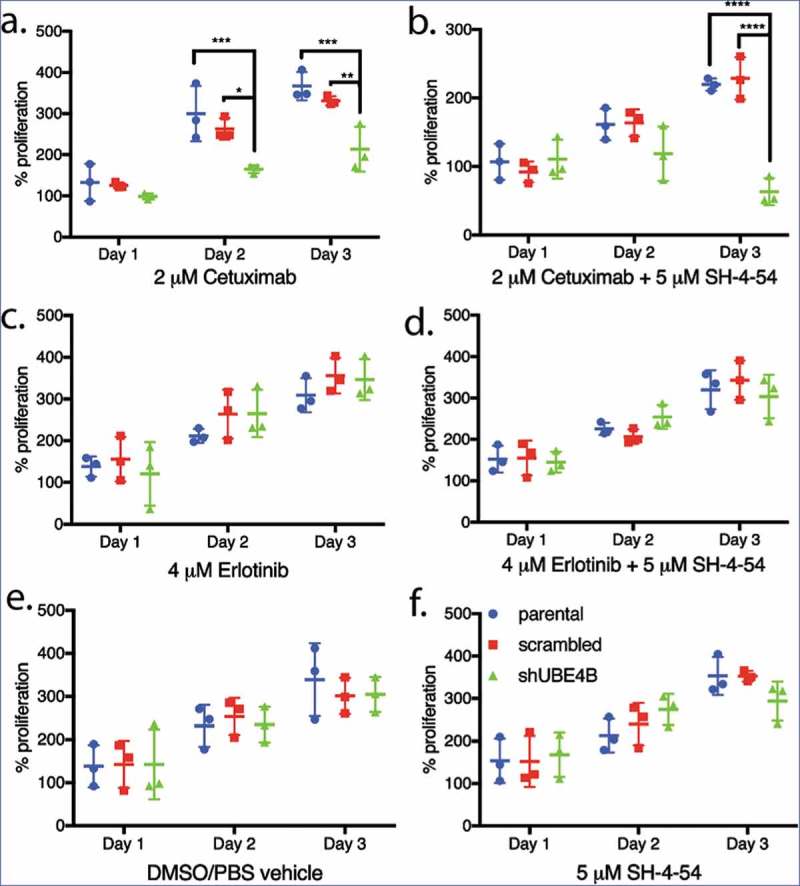
Figure 5.

Proliferation of wild type, scrambled, and UBE4B-depleted SK-N-AS neuroblastoma cells measured following treatment with either (a) Cetuximab alone, (c) Erlotinib alone, (b) a combination of Cetuximab with the STAT5 inhibitor, SH-4-54 (d) or a combination of Erlotinib with SH-4-54. Controls included treatment with the vehicle alone (e) or the STAT5 inhibitor SH-4-54 (f). Proliferation was assessed using an MTT assay every 24 hrs for 72 hrs. Percent proliferation is determined by dividing absorbance at day 1, 2, or 3 by the absorbance taken at day 0 (prior to drug administration) (n = 3). All data points and the mean ± S.E.M. are displayed for each time point and reflect the average of three independent trials. Comparisons were made using ANOVA with post hoc Dunnett multiple comparison test. * denotes p < .05, ** denotes p < .01, *** denotes p < .001.
