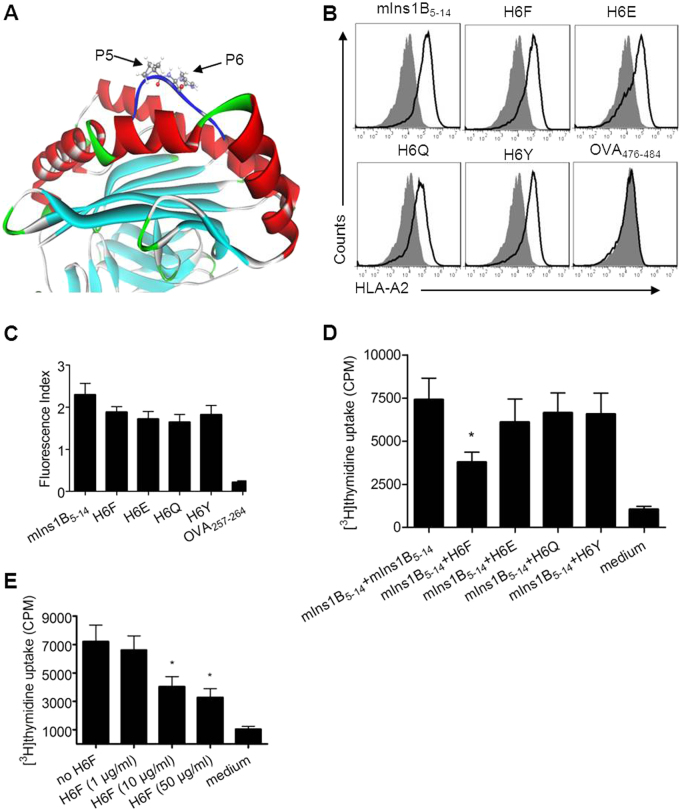
Fig. 1.
Design and selection of a potential antagonist peptide for mIns1B5–14. a The modeled structure of the mIns1B5–14-HLA-A*0201 complex showing that the p5 and p6 positions of mIns1B5–14 bulged out of the binding groove, which were more accessible for TCR inspection. b T2 cell-based peptide binding assays for HLA-A*0201 were performed by FACS analysis. T2 cells were incubated with or without the indicated peptides (10 μg/ml) and the level of surface HLA-A2 molecules was detected by flow cytometry. The H-2Kb-binding peptide OVA257-264 was used as a negative control. Filled histograms, no peptide; open histograms, plus peptide. c The fluorescence index (FI) was calculated as follows: FI = (mean fluorescence intensity with the given peptide―mean fluorescence intensity without peptide)/(mean fluorescence intensity without peptide). Bars represent the mean ± SEM of three independent experiments. d, e The proliferation of splenocytes stimulated with mIns1B5–14 (10 μg/ml) plus itself (10 μg/ml) or the indicated APLs (10 μg/ml) (d) and H6F at four different concentrations (e) was measured by [3H] thymidine incorporation. Bars represent the mean ± SEM of seven independent experiments. Significance was determined by an unpaired t-test

