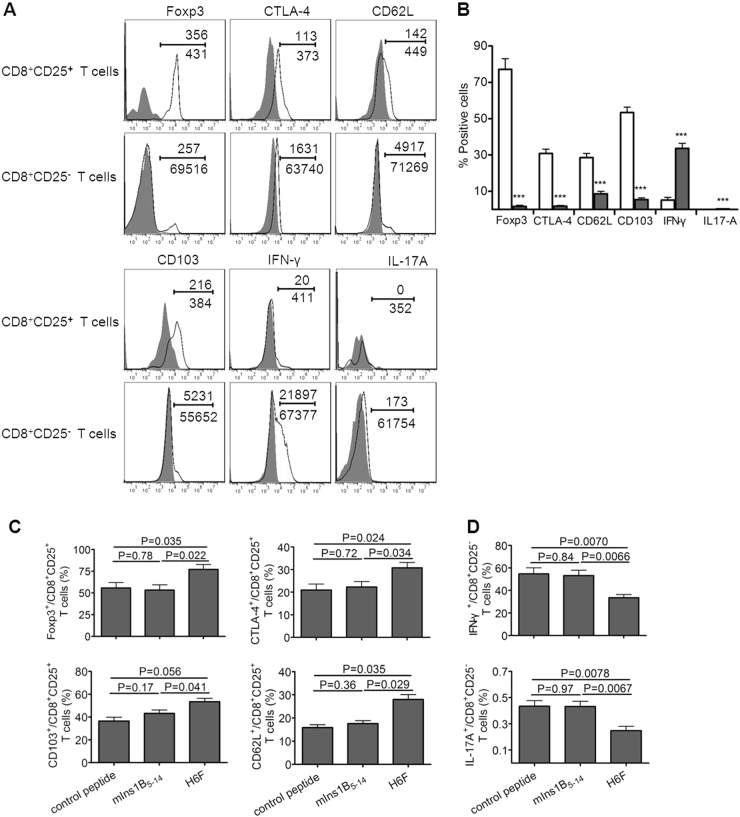
Fig. 6.
Phenotypic characterization of CD8+CD25+ T cells in the NOD.β2mnull.HHD mice. CD8+CD25+ and CD8+CD25− T cells were freshly isolated from the spleens of H6F-treated nondiabetic NOD.β2mnull.HHD mice at the age of 12 weeks (n = 5) and these cells were phenotyped by flow cytometry analysis. a Representative flow cytometry phenotypic profiles of CD8+CD25+ and CD8+CD25- T cells in H6F-treated NOD.β2mnull.HHD mice. The numbers above the line indicate the event numbers of cells with a positive phenotype in the indicated cell subsets, and the numbers below the line indicate the total numbers of the indicated CD8+CD25+ T cells or CD8+CD25- T cells. b The mean percentages of Foxp3+, CTLA-4+, CD62L+, CD103+, IFN-γ+ and IL-17A+ in CD8+CD25+ (open bars) or CD8+CD25- (gray bars) T cells from H6F-treated NOD.β2mnull.HHD mice (n = 5). ***Compared to the same phenotype or cytokine production of CD8+CD25+ T cells, P < 0.001. The data are expressed as the mean ± SD. c The mean percentages of Foxp3+, CTLA-4+, CD103+, and CD62L+ in splenic CD8+CD25+ T cells or d the mean percentages of IFN-γ+ and IL-17A+ in splenic CD8+CD25- T cells isolated from different peptide-treated NOD.β2mnull.HHD mice (n = 5). The data are expressed as the mean ± SD. Significance was determined by an unpaired t-test

