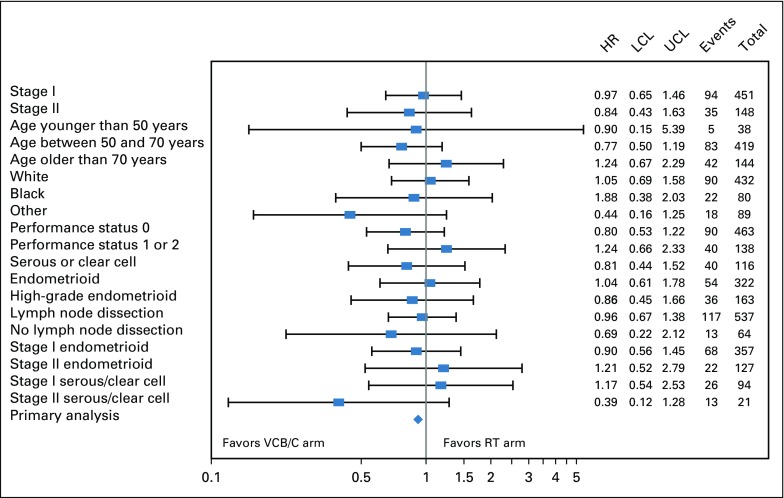
FIG 4.
Forest plot of recurrence-free survival (RFS) by treatment of selected subgroups. RFS treatment hazard ratio (HR) estimates on the basis of a Cox proportional hazards model for selected subgroups are displayed in a forest plot and plotted on the log scale with a 95% CI. The HR estimate is represented graphically by a vertical dash; the CI is represented by a horizontal line. The relative HR estimates and variance of the log HR are listed. The HRs are relative to the radiation therapy (RT) arm and vary around 1.0. The vertical line at 1.0 represents no difference in the hazard rates; to the right favors WPRT and to the left favors the arm with vaginal cuff brachytherapy plus chemotherapy (VCB/C). None of the CIs exclude 1.0. LCL, lower confidence limit; UCL, upper confidence limit.

