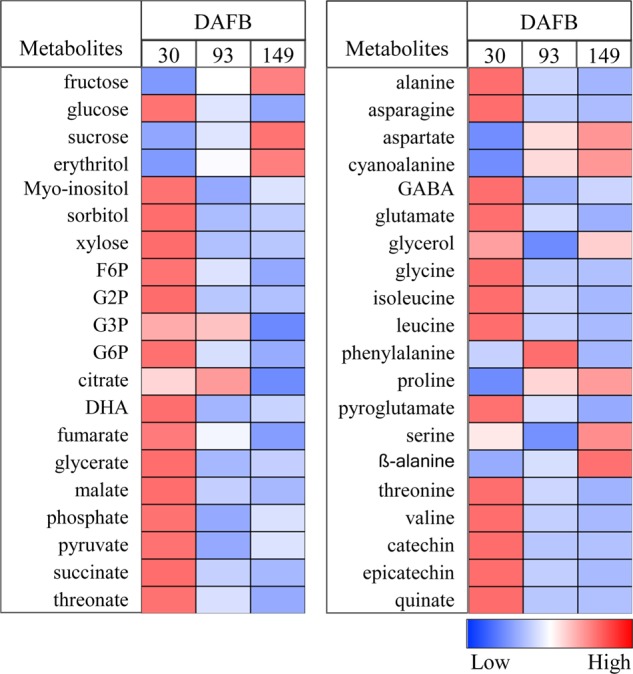
Fig. 2. Heat maps showing the changes in primary metabolite levels during apple fruit development.

The fruit was harvested at three growth stages: 30, 93, and 149 days after full bloom. The colors were generated from GC-MS metabolite profiling raw data (relative value) after mean center and scale transformation into comparable levels. The light blue color denotes a lower concentration of metabolites, whereas the deep red color denotes a higher concentration of metabolites. Values are means ± SE (n = 3). Heat maps were generated using the MultiExperiment Viewer software (MeV v4.9.0, http://www.tm4.org/)32. DHA dehydroascorbate, F6P fructose 6-phosphate, G2P glucose 2-phosphate, G3P glucose 3-phosphate, G6P glucose 6-phosphate, GABA γ-aminobutyrate
