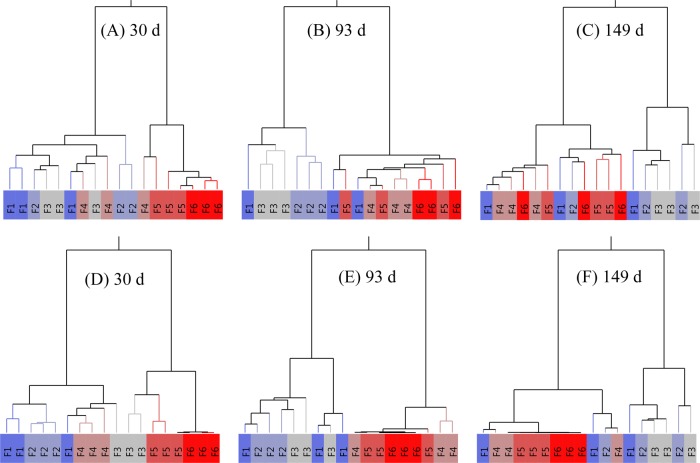
Fig. 5. Hierarchical cluster analysis (HCA) of metabolite data along a density gradient.
HCA plot was performed for the three independent replicates based on the scaled data, considering the distribution of either primary (A─C) or secondary (D─F) metabolites between the six fractions. The analysis was performed for the three developmental stages of the fruit (30, 93, and 149 d after full bloom). The deep blue (dense fraction F1) to deep red (light fraction F6) colors represent the density gradient of the replicated six fractions. In the heat map, identical gradient fractions are encoded with the same color

