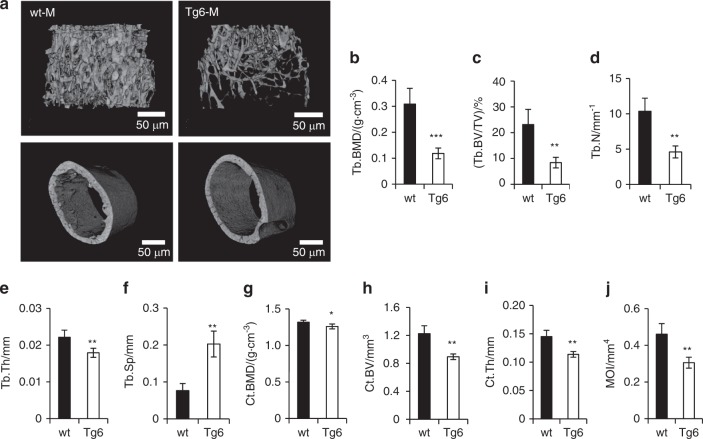
Fig. 1.
Bone features of Tg6 mice overexpressing EPO. a Micro-CT generated 3D images of trabecular (top) and cortical bone (bottom) of the femurs of 11-week-old wild-type (wt; left) and Tg6 mice (right). b–f Quantification of trabecular parameters including trabecular bone mineral density (BMD), bone volume/total volume (BV/TV), number (N), thickness (Th), and spacing (Sp) of trabeculae. g–j Quantification of cortical BMD, BV, thickness, and moment of inertia (MOI) (n = 4/group, *P < 0.05, **P < 0.01, ***P < 0.001)

