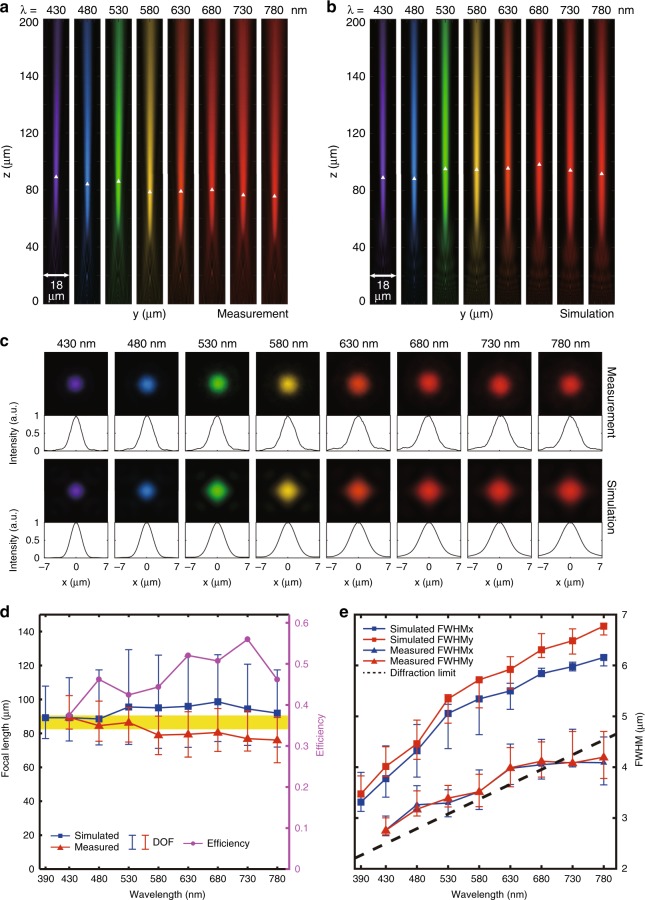
Fig. 4. Measurement and simulation results for a single broadband achromatic metalens with a diameter of 14 μm.
a Measured normalized intensity distributions on a linear scale in the y–z plane using pseudo colors corresponding to their respective wavelengths. The wavelengths of incidence are denoted on the top. The focal points are marked by white triangles. b Corresponding simulated normalized intensity distributions. c Measured and simulated normalized intensity distributions on a linear scale in the focal plane. d Measured (blue square points) and simulated (red triangle points) focal lengths at different wavelengths. The average measured focal length is approximately 81.5 μm, yielding an NA of 0.086. The error bars show the depth of focus (DOF), which is defined here as the range around the focus at which the normalized intensity has fallen to 0.95. Since the metalens can still effectively perform imaging inside the DOF, an achromatic region (yellow area) can be obtained by analyzing the error bars at all wavelengths The purple dotted line shows that the measured focusing efficiency can be maintained in the range of 36% ~ 55% at the measured wavelengths, while the maximum is reached at 730 nm. e Measured (triangles) and simulated (squares) full width at half maximums (FWHMs) at different wavelengths. The blue color denotes the results in the x-direction, while the red color denotes the results in the y-direction. The error bars show the ranges of the FWHM inside the DOF regions

