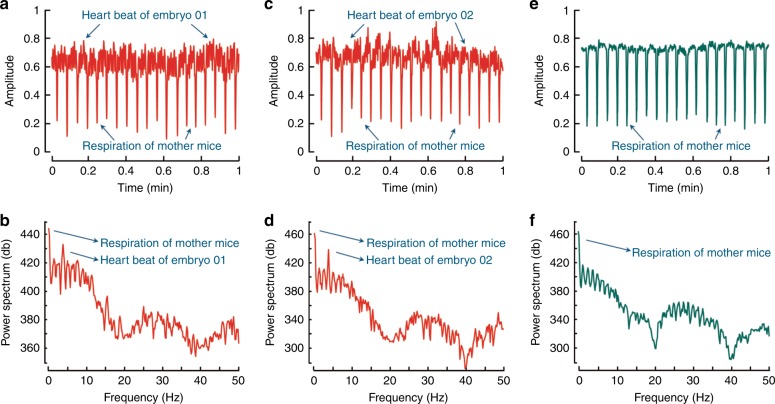
Fig. 2. Analyses of the respiratory motion of an E19 mother mouse and embryo heartbeat.
Time activity curves of the OA signal acquired from two different embryo hearts are shown in (a, c) with their corresponding frequency spectra plotted in (b, d). No spatio-temporal averaging was applied for calculating the plots. Respiration of mother mice can be approximated at 0.7 Hz, whereas the embryo heartbeat falls in the 4–5 Hz range. The labelled frequency peaks embody the heartbeats of embryos and respiration of mother mice. e Changes in the OA signal at the maternal peripheral artery capture only its respiratory motion, which is also prominent in its corresponding Fourier spectrum in (f)

