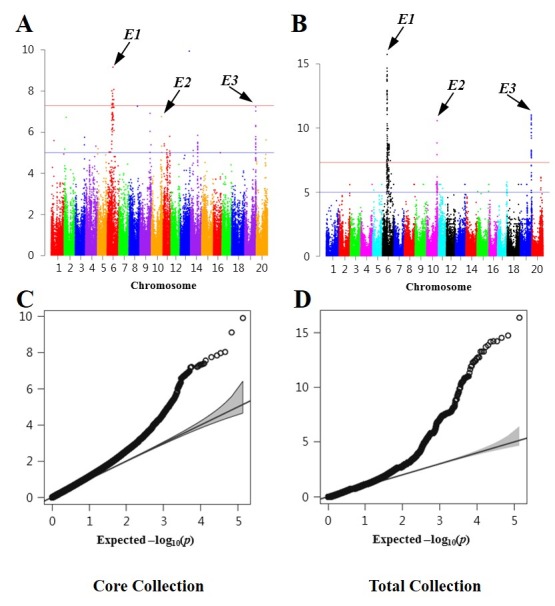
Fig 8. GWAS for days to flowering in the core collection and the total collection.

(A) Manhattan plot of the core collection. (B) Manhattan plot of the total collection. (C) Quantile-Quantile plot for days to flowering in the core collection. (D) Quantile-Quantile plot for days to flowering in the total collection.
