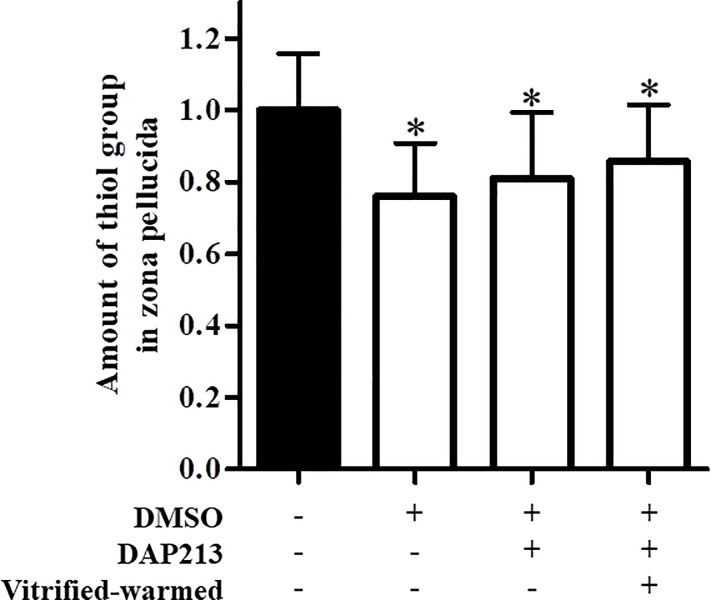
Fig 3. Thiol levels following treatment with cryoprotectants.
Relative fluorescence intensity was calculated as follows: fluorescence intensity of vitrified–warmed oocytes precultured with NAC / fluorescence intensity of fresh oocytes. Results are expressed as mean ± SD (fresh: n = 85, DMSO: n = 85, DAP213: n = 52, thawed: n = 86). *P < 0.05 compared with fresh oocytes [DMSO (−), DAP213 (−), vitrified–warmed (−)].

