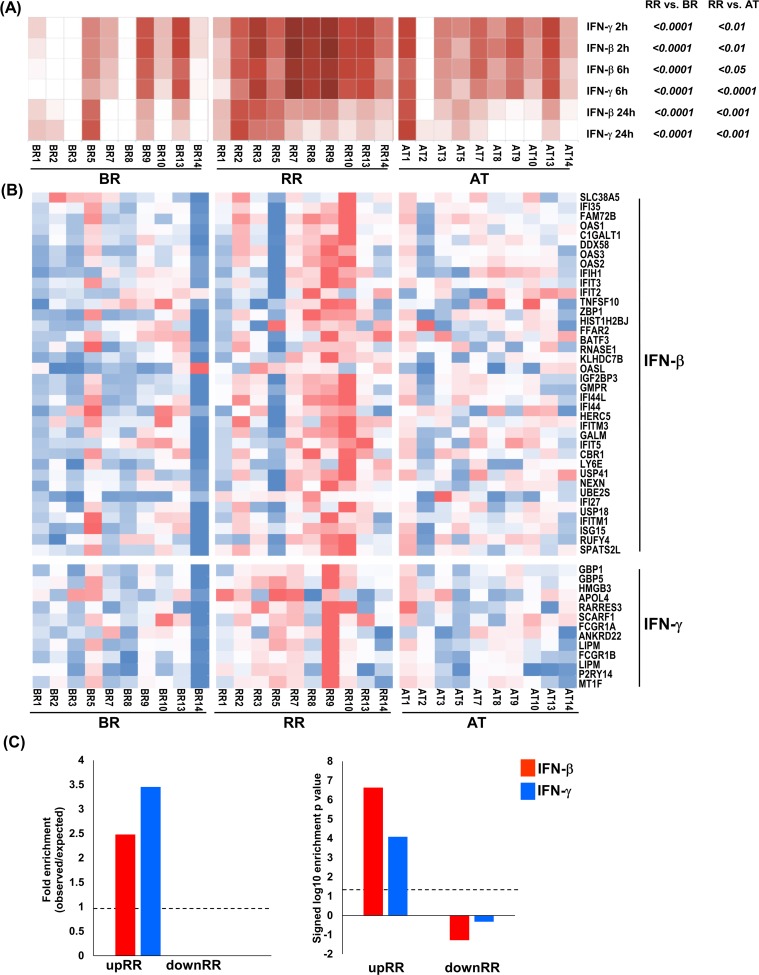
Fig 2. IFN-β and IFN-γ signature on RR samples.
(A) IFN-β and IFN-γ gene expression signature by SaVant. For each time point of the IFN-β and IFN-γ MDM gene expression data, signature enrichment scores were calculated using average gene expression for each RR temporal stages and normalized to Z scores. Columns correspond to RR temporal stages and rows correspond to IFN signature; each individual square corresponds to the enrichment for one IFN signature in a specific RR sample for each subtype. P-value was calculated by one-tailed ANOVA, followed by Tukey's multiple comparisons test. (B) Heatmap showing the normalized counts for the 38 and 13 overlapped genes between RR upregulated genes and IFN-β and IFN-γ MDM specific genes, respectively. (C) Enrichment analysis of overlap between IFN-β and IFN-γ- specific upregulated genes identified in human MDMs and RR and BR/AT specific leprosy whole blood transcripts (fold change ≥ 1.2 and P ≤ 0.05). Dotted lines indicate either the expected fold enrichment of one (left) or the hypergeometric enrichment p-value of 0.05 (log P = 1.3, right). Hypergeometric analyses were performed to determine fold enrichment (observed/expected) and signed log enrichment p- value (negative for de-enriched). The Bonferroni multiple hypothesis test correction was applied for each group. RR temporal stages: BR = before reaction, RR = during reversal reaction and AT = after treatment. N = 10 for each RR subtype.

