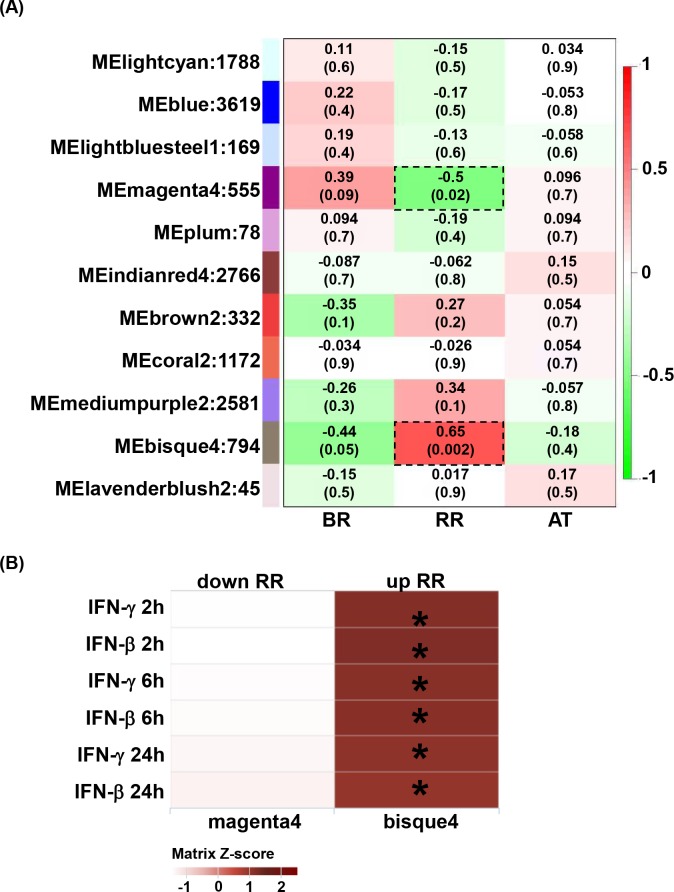
Fig 4. Gene expression in whole blood from RR temporal stages.
(A) Identification of RR whole blood subtype gene modules. WGCNA eigengene modules correlated to at least one RR temporal subtype (p ≤ 0.05). Red indicates a positive correlation, and green indicates an inverse correlation. Module eigengenes, as well as the corresponding number of genes in each module, are labeled on the y axis, and RR temporal stages are labeled on the x axis. BR (before reaction), RR (reaction) and AT (after reaction treatment). (B) Integration of WGCNA gene modules with cell-type-specific gene signatures. For the two significant modules derived from WGCNA, enrichment for MDM IFN-β and IFN-γ specific downstream genes (2h, 6h and 24h) were calculated and displayed in a heatmap of Z scores. Hypergeometric analyses were performed to determine enrichment p-value. * p<0.001.

