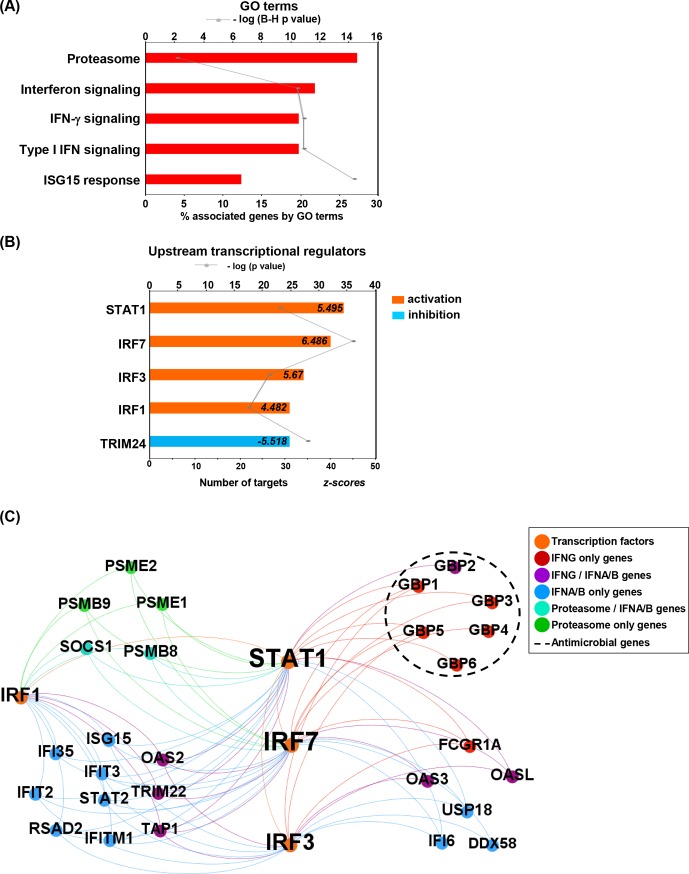
Fig 5. Functional analysis (434 common genes between bisque4 and upregulated genes).
(A) Top 5 functional GO terms for the 434 common genes between the RR positively correlated module and RR upregulated genes. Graphs show the number of associated genes, -log p-value and 5 hits for each GO term. Padj was calculated with B-H multiple testing for the association of the functional term with the gene-expression data. (B) Top 5 upstream transcriptional factors for the 434 common genes. The upstream analysis was performed by IPA upstream regulator analysis. Graphs show the number of target genes, -log p-value and z-score for each transcriptional factor. Orange and positive z-score for activation and blue and negative z-score for inhibition. (C) Integrated network of gene expression, upstream regulators and functional analysis terms. Gephi was used to create a functional annotation network, showing connections among significant GO terms, IPA upstream regulator analysis and 434 common genes between bisque4 module and upregulated significantly expressed genes. Genes are colored by term a, transcription factors in orange and connections are represented by dotted lines.

