Figure 3.
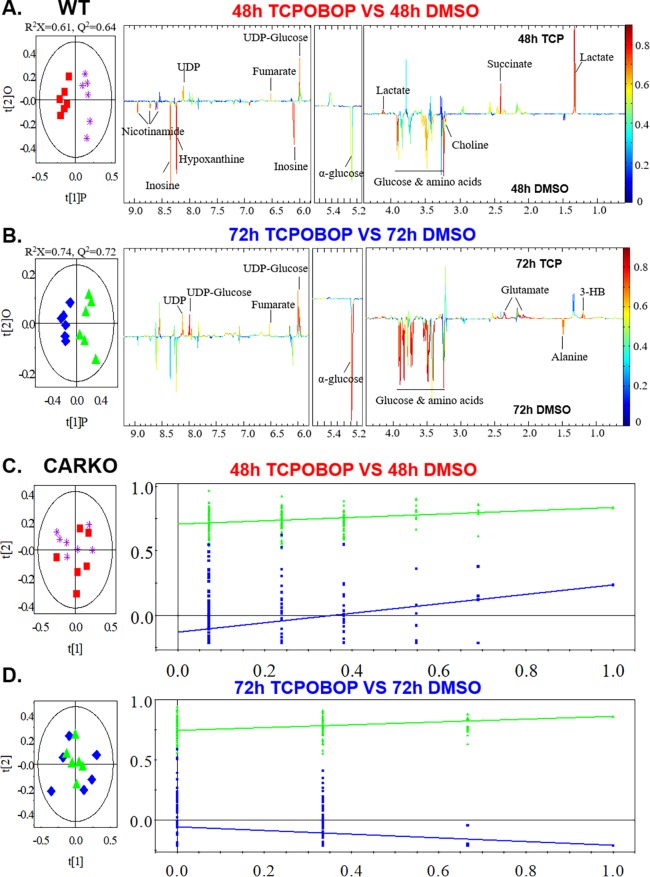
Mouse liver tissue was extracted and subjected to 1H NMR. Multivariate data analysis was performed to evaluate the differences between DMSO and TCPOBOP treated WT mice at 48 (A) and 72 h (B) time points as well as CARKO mice at 48 (C) and 72 h (D). OPLS-DA scores (left) and coefficient-coded loadings plots (right) for the models were obtained from NMR data. The OPLS-DA models were validated using a 7-fold cross validation method, and the quality of the model was described by the parameters R2X and Q2 values. Color-coded correlation coefficient loading plots were employed to indicate the significance of the metabolite contribution to the class separation with a “hot” color (e.g., red) being more significant than a “cold” color (e.g., blue). A cutoff value of |r| > 0.707 (r > +0.707 and r < −0.707) was chosen for the correlation coefficient as significant based on the discrimination significance (p ≤ 0.05).

