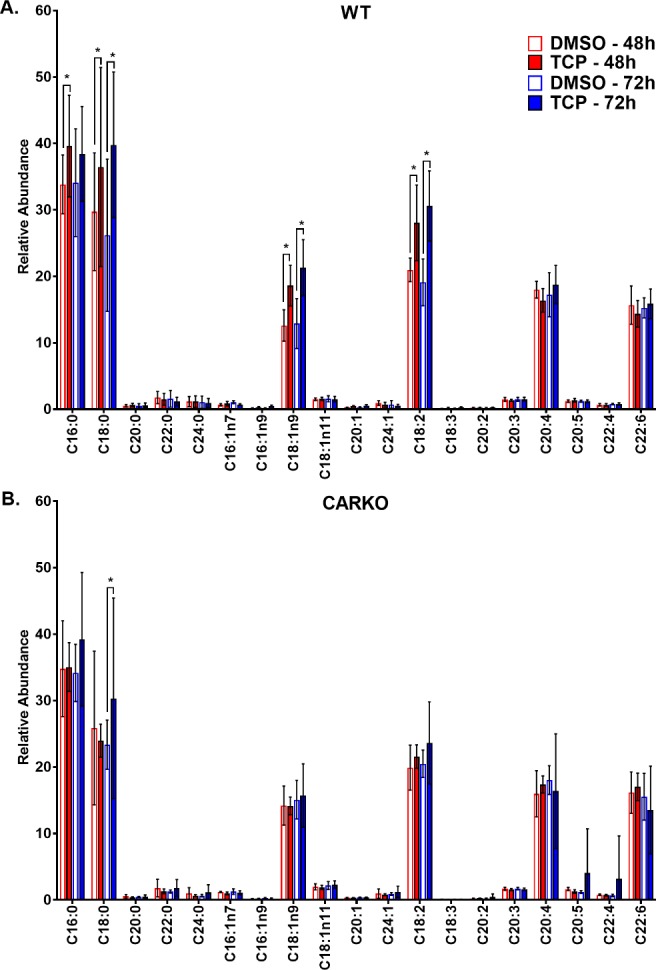
Figure 5.

GC–MS fatty acid profile of mouse liver tissue from WT (A) and CARKO (B) mice treated with DMSO and TCPOBOP at 48 and 72 h time points. Data are represented as the mean of biological replicates and standard deviation. Significance between DMSO and TCPOBOP treatments at each time point indicated by * (p < 0.05).
