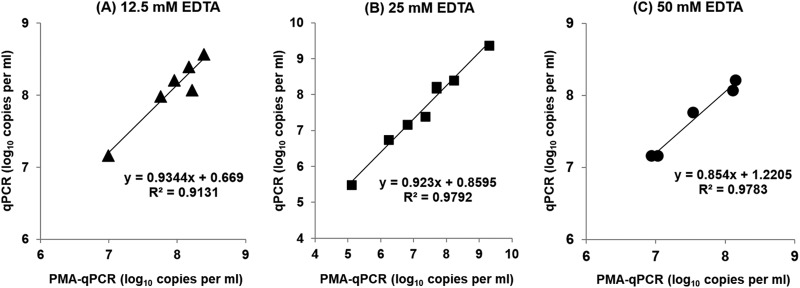
FIG 3.
Correlation of C. coli cell equivalent counts (mean value from three aliquots) in bacterial suspensions in exponential phase (CAMHB) obtained by qPCR and PMA-qPCR during independent experiments (each symbol represents the result of an independent experiment). The concentrations of EDTA in S1 and S2 buffers for spheroplast formation (PMA-qPCR) were 12.5 mM (A), 25 mM (B), and 50 mM (C). The corresponding linear-regression equations and correlation coefficient (R2) values are presented in the diagrams.

