
FIG 7.
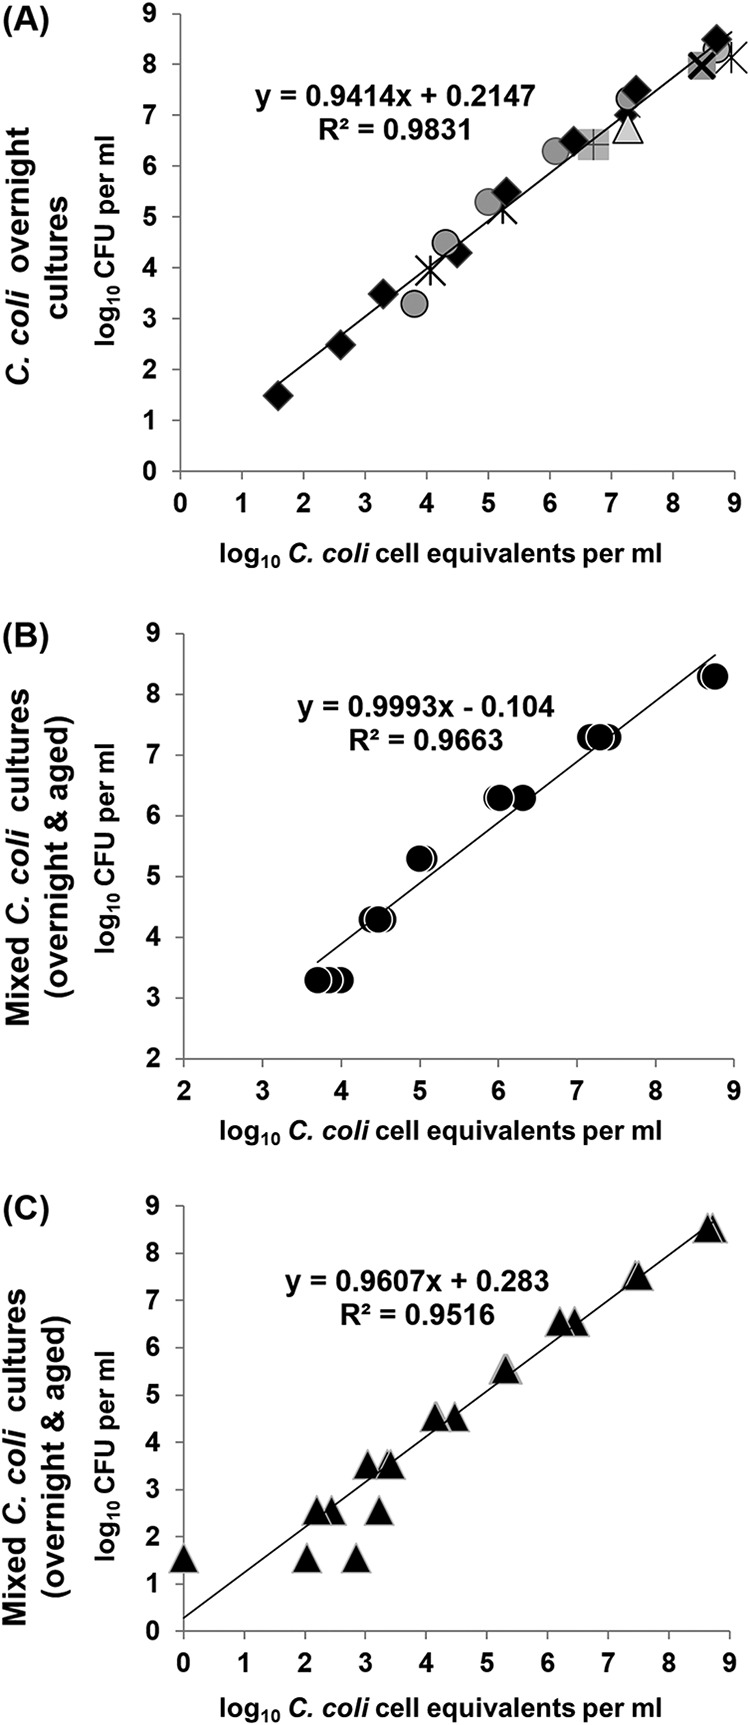
Correlation of viable C. coli counts obtained by the weighted means of numbers of CFU on duplicate CBA plates (y axis) and cell equivalents in triplicate aliquots obtained by spheroplasting-PMA-qPCR with ISPC (x axis). (A) Various overnight cultures during seven independent experiments (four original suspensions and three original suspensions with 10-fold serial dilutions; 1.5 to 8.5 log10 CFU ml−1); (B) original suspension and 10-fold serial dilutions of an overnight culture (3.3 to 8.3 log10 CFU ml−1), all mixed individually with 6 log10 CFU of a 96-day-old culture in CAMHB; (C) original suspension and 10-fold serial dilutions of a single overnight culture (1.5 to 8.5 log10 CFU ml−1), all mixed individually with 5 log10 CFU of a 103-day-old culture in CAMHB. Each symbol represents the mean value of triplicate aliquots (A) and the value of one aliquot (B and C). The corresponding linear-regression equations and correlation coefficient (R2) values are presented in the diagrams.