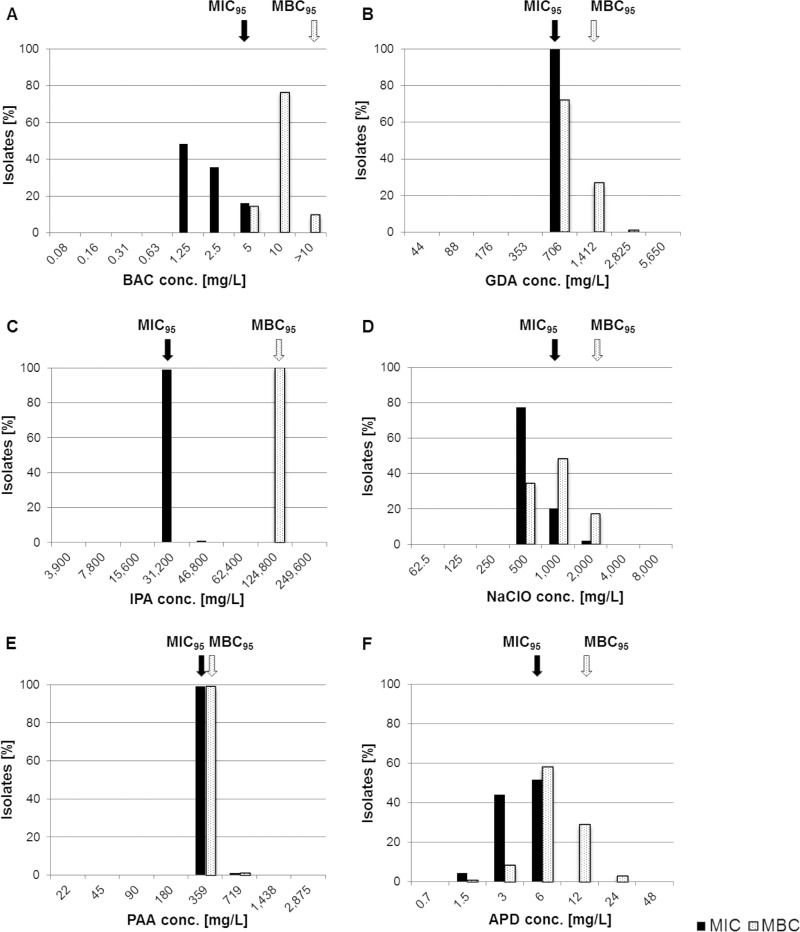
FIG 1.
MIC (black bars) and MBC (white bars) distributions of 93 L. monocytogenes isolates. Arrows mark MIC95 (black) and MBC95 (white) values representing tentative ECOFFs. conc., concentration; ECOFF, epidemiological cutoff; BAC, benzalkonium chloride; GDA, glutaraldehyde; IPA, isopropanol; NaClO, sodium hypochlorite; PAA, peracetic acid; APD, biocidal product containing bis(3-aminopropyl)dodecylamine.

