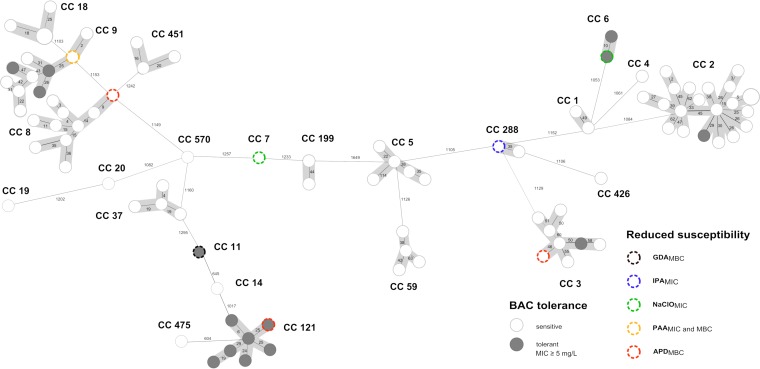
FIG 2.
Minimum-spanning tree based on core genome MLST (cgMLST) allelic profiles of 93 L. monocytogenes isolates from food production environments in Germany. Each circle represents an allelic profile derived from sequence analysis of 1,701 cgMLST target genes. The size of each circle corresponds to the number of isolates. Numbers on the connecting lines illustrate numbers of target genes with differing alleles in a pairwise comparison. Isolates with reduced biocide susceptibility are color-coded as specified in the legend. Allelic patterns belonging to identical MLST clonal complexes (CC) are shaded in gray. BAC, benzalkonium chloride; GDA, glutaraldehyde; IPA, isopropanol; NaClO, sodium hypochlorite; PAA, peracetic acid; APD, biocidal product containing bis(3-aminopropyl)dodecylamine.

