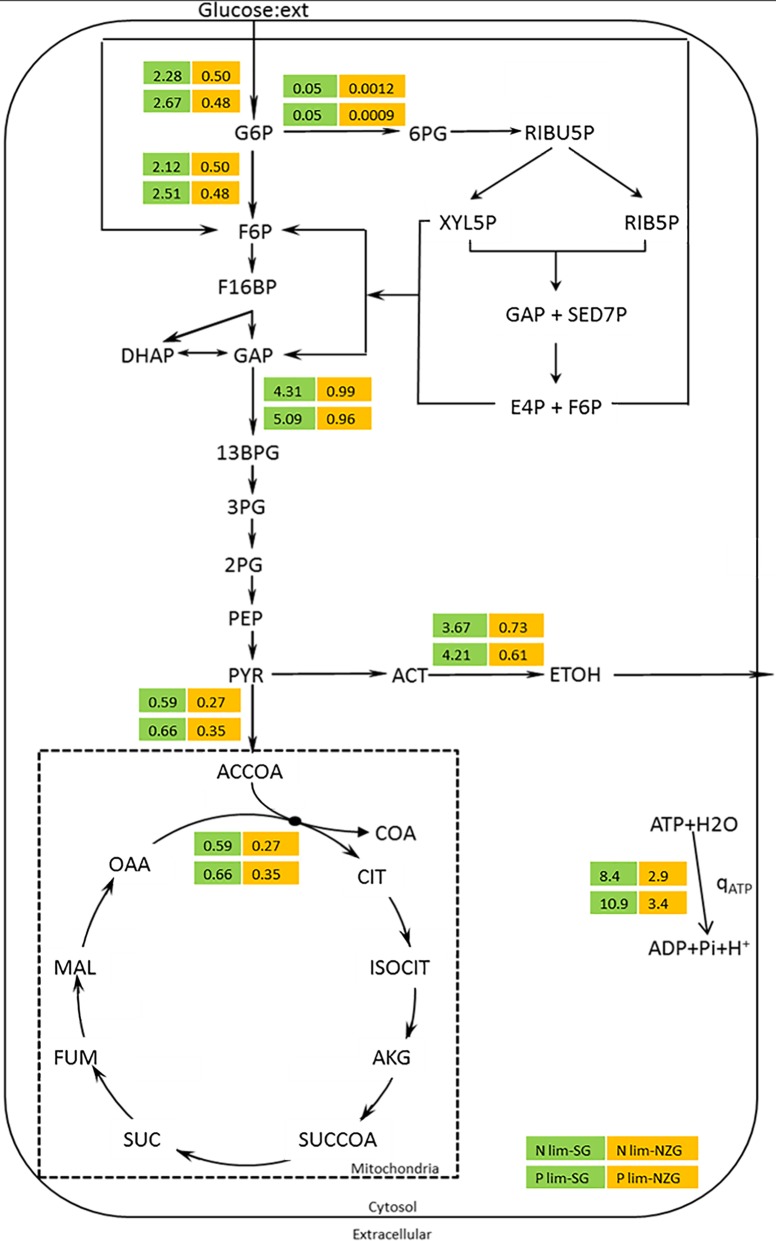
FIG 3.
Metabolic flux analysis in aerobic ammonium- and phosphate-limited (N- and P-limited) cultures of S. cerevisiae CEN.PK113-7D. Flux values present the steady-state, slow-growth (SG) (μ = 0.025 h−1) chemostat cultures (numbers on green background) and the pseudo-steady-state, near-zero-growth (NZG) (μ < 0.002 h−1) retentostat cultures (numbers on orange background). Data are expressed in millimoles of per gram of viable biomass per hour and represent the averages for duplicate cultures. Complete flux analysis values and standard errors are presented in Table S3 in the supplemental material. Glucose:ext, extracellular metabolite glucose.

