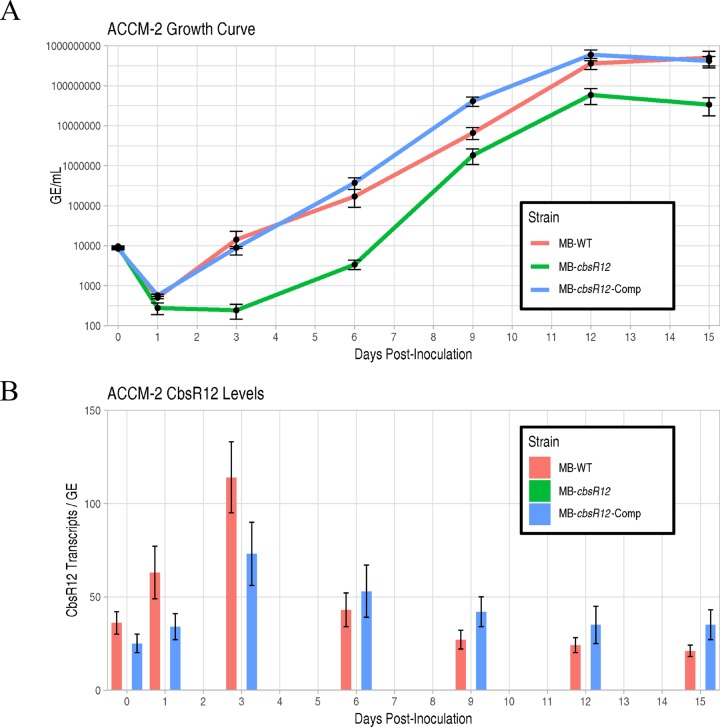
FIG 2.
CbsR12 production and growth effects on C. burnetii grown in ACCM-2. (A) Growth curves for MB-WT, MB-cbsR12, and MB-cbsR12-Comp in ACCM-2 as determined by qPCR. The 0-dpi time point refers to the inoculum. Values represent means ± the standard error of means (SEM) from three technical replicates. The data are representative of three independent experiments with consistent and indistinguishable results. (B) CbsR12 production over time for MB-WT, MB-cbsR12, and MB-cbsR12-Comp grown in ACCM-2, as determined by qRT-PCR. Values represent means ± the SEM of three independent determinations.

