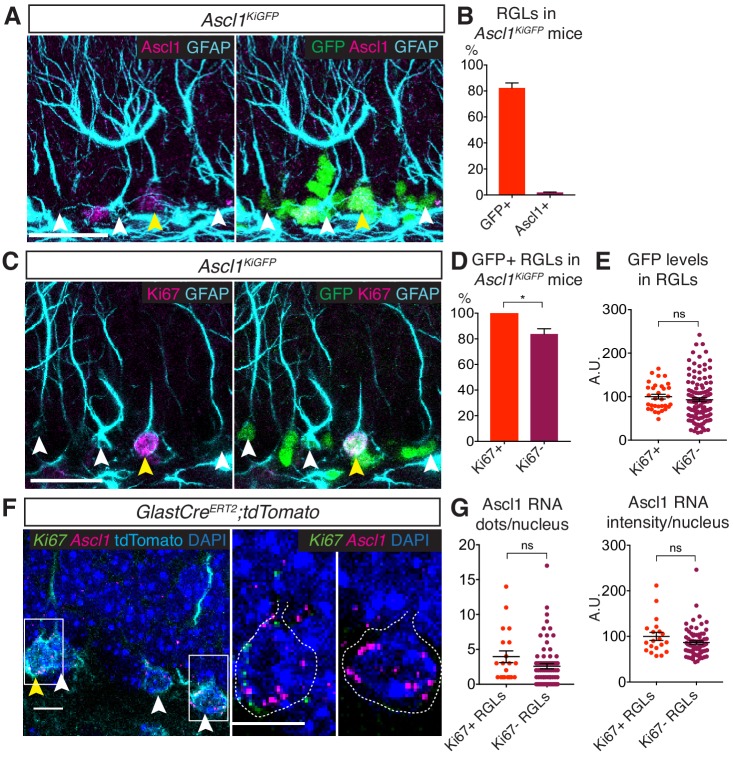
Figure 1. Ascl1 is transcribed in both quiescent and proliferating hippocampal stem cells.
(A) Immunolabeling for GFP, Ascl1 and GFAP in the subgranular zone (SGZ) of the dentate gyrus (DG) of Ascl1KIGFP reporter mice. White arrows indicate GFP+Ascl1- RGLs; yellow arrows indicate GFP+Ascl1+ RGLs. Scale bar, 30 µm. (B) Quantification of the data shown in (A). The widespread GFP expression indicates that Ascl1 is transcribed in most RGLs (radial GFAP+ cells) in Ascl1KIGFP mice while Ascl1 protein is only detectable in a small fraction of RGLs. n = 3. (C) Immunolabeling for GFP, Ki67 and GFAP in the SGZ of the DG of Ascl1KIGFP reporter mice. White arrows indicate GFP+Ki67- RGLs; yellow arrows indicate GFP+Ki67+ RGLs. Scale bar, 30 µm. (D, E) Quantification of the data in (C). Most quiescent (Ki67-) RGLs express GFP and therefore transcribe Ascl1 (p=0.017) (D) and the levels of GFP are not significantly different in quiescent and proliferating RGLs (p=0.429) (E), indicating that Ascl1 is transcribed uniformly in the two RGL populations. n = 3. (F) RNA in situ hybridization by RNAscope with an Ascl1 probe (magenta) and a Ki67 probe (green) and immunolabeling for tdTomato to mark RGLs in the SGZ of the DG. To label RGLs with tdTomato, Glast-CreERT2;tdTomato mice were injected once at P60 with 4-hydroxytamoxifen, and analyzed 48 hr later. White arrows indicate RGLs positive for Ascl1 RNA staining; yellow arrows show RGLs positive for both Ascl1 and Ki67 RNA. Magnifications of the RGLs marked by white boxes are shown on the right, highlighting an RGL positive for both Ascl1 and Ki67 RNA, and an RGL positive for only Ascl1 RNA. Dotted lines show the outline of the tdTomato signal. Scale bar, 10 µm. n = 5. (G) Quantification of the data in (F). Ascl1 transcripts are found at a similar level in quiescent (Ki67-) and proliferating (Ki67+) RGLs (dots/nucleus p=0.101; intensity/nucleus p=0.112). Note the high variability in the levels of Ascl1 mRNA, which could be a reflection of the oscillatory nature of Ascl1 expression (Imayoshi et al., 2013). n = 5. Error bars represent mean ± SEM. Significance values: ns, p>0.05; *, p<0.05; **, p<0.01; ***, p<0.001; ****, p<0.0001.

