. 2019 Sep 25;8:e48561. doi: 10.7554/eLife.48561

Figure 6. Loss of Id4 results in activation of quiescent RGLs in the adult hippocampus.

(A) Design of the experiment for acute and long-term deletion of Id4 from RGLs of the adult hippocampus using Id4cKO mice. (B) Immunolabeling for GFAP, tdTomato, Ascl1 and DAPI staining in control and Id4cKO mice after 5 days of tamoxifen administration. Yellow arrows indicate Ascl1-positive RGLs. Scale bar, 30 µm. (C–D) Quantification of Ascl1 protein in tdTomato+ RGLs in control, Id4Het and Id4cKO mice after 5 days of tamoxifen administration. Loss of both copies of Id4 results in increases in the number of Ascl1-expressing cells and in the levels of Ascl1 protein in RGLs (Control vs Het p=0.3276; Control vs cKO p=0.0067; Het vs cKO p=0.0381; protein levels p=2.01E-5). n = 4 for control, Id4Het and Id4cKO mice. (E) Quantification of Ascl1 protein in tdTomato+ RGLs control, Id4Het and Id4cKO mice 30 days after tamoxifen administration. The percentage of RGLs positive for Ascl1 is increased in Id4cKO mice compared with control mice 30 days after Id4 deletion (Control vs Het p=0.996; Control vs cKO p=0.311; Het vs cKO p=0.315). n = 5 for control and Id4Het mice, n = 6 for Id4cKO mice. (F) Immunolabeling for GFAP, tdTomato, Ki67 and DAPI staining in control and Id4cKO and control mice after 5 days of tamoxifen administration. Yellow arrows indicate Ki67-positive RGLs. Scale bar, 30 µm. (G–H) Quantification of the fraction of Ki67+ tdTomato+ RGLs in control, Id4Het and Id4cKO mice, 5 days (G) and 30 days (H) following tamoxifen administration. The percentage of Ki67+ tdTomato+ RGLs is strongly increased following acute deletion of both copies of the Id4 allele, and remained significantly increased, albeit to a lesser extent, following long-term deletion. (Control vs Het P65 p=0.7595, P90 p=0.980; Control vs cKO P65 p=0.0049, P90 p=0.0036; Het vs cKO p=0.0101, P90 p=0.0026). n = 4 for P65 control, Id4Het and Id4cKO mice at P65; n = 5 for P90 control, Id4Het and Id4cKO mice. (I) Immunolabeling for GFAP, tdTomato, Id1 and DAPI staining in control and Id4cKO and control mice 30 days after tamoxifen administration. Yellow arrows indicate Id1-positive RGLs. Scale bar, 30 µm. (J) Quantification of the fraction of Id1+ tdTomato+ RGLs 30 days after tamoxifen administration in control and Id4cKO mice. Loss of Id4 results in a 2-fold increase in the fraction of tdTomato+ RGLs positive for Id1 immunoreactivity, from 38.3 ± 4.5% to 74.1 ± 1.0% (p=0.0016). n = 3 for both control and Id4cKO. (K) Immunolabeling for GFAP, tdTomato, Id3 and DAPI staining in control and Id4cKO and control mice 30 days after tamoxifen administration. Yellow arrows indicate Id3-positive RGLs. Scale bar, 30 µm. (L) Quantification of the fraction of Id3+ tdTomato+ RGLs in (K). Id3 is increased by more than 8-fold in tdTomato+ RGLs following Id4 deletion, from 9.7 ± 1.0% to 75.3 ± 1.1% (p=1.87E-6). n = 4 for control mice and n = 3 for Id4cKO mice. Error bars represent mean ± SEM. Significance values: ns, p>0.05; *, p<0.05; **, p<0.01; ***, p<0.001; ****, p<0.0001. See also Figure 6—figure supplement 1.

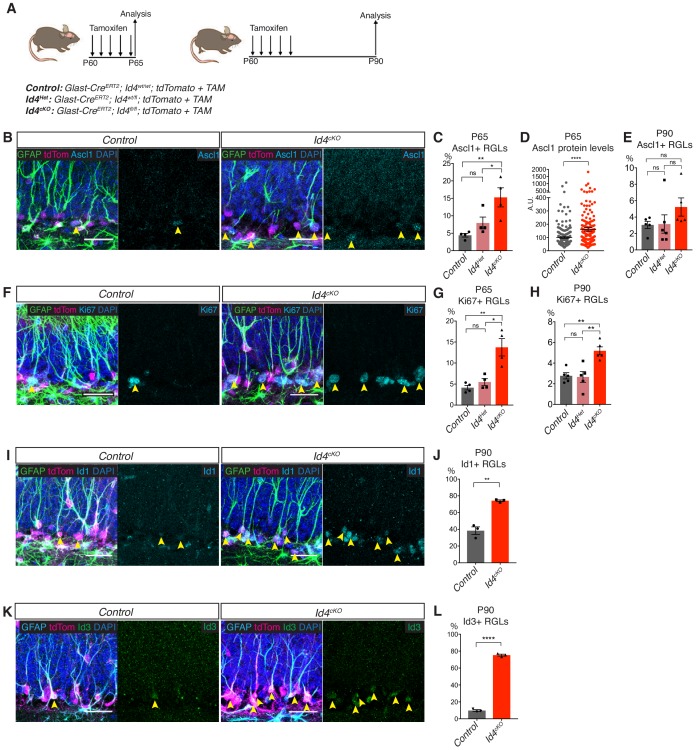
Figure 6—source data 1. Original quantification of Ascl1, Ki67, Id1 and Id3 protein levels in RGLs following Id4 deletion.
DOI: 10.7554/eLife.48561.020

Figure 6.

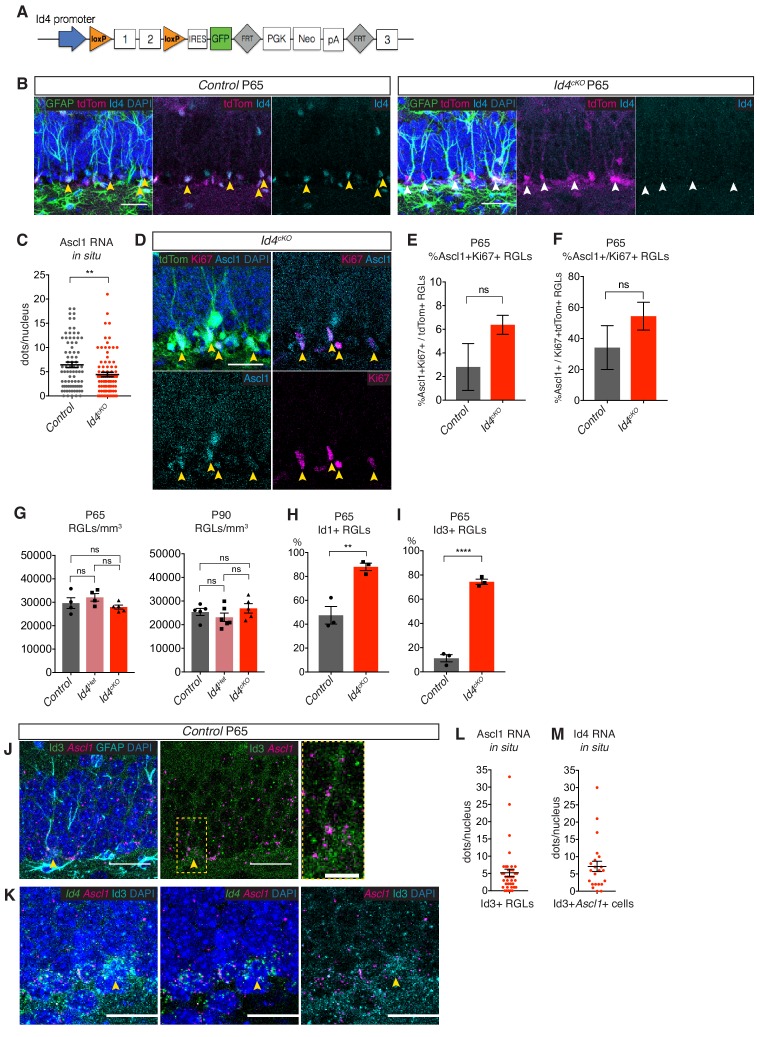
Figure 6—figure supplement 1. Expression of Id4, Ascl1, Ki67, Id1 and Id3 in RGLs following loss of Id4.

Figure 6—figure supplement 1.

(A) Structure of the Id4flox allele. (B) Immunolabeling for GFAP, tdTomato, Id4 and DAPI staining in control and Id4cKO mice demonstrating Id4 elimination in Id4cKO mice after 5 days of tamoxifen administration. Yellow arrows indicate tdTom+Id4+ RGLs; white arrows indicate tdTom+Id4- RGLs. Scale bar, 30 µm. (C) Quantification of single molecule RNA in situ hybridization (RNAscope) for Ascl1 RNA in control and Id4cKO mice 5 days of tamoxifen administration. Ascl1 transcripts are decreased following Id4 deletion, suggesting the increased protein level is a result of post-transcriptional regulation. n = 2 mice for both control and Id4cKO. (D) Immunolabeling for tdTomato, Ascl1, Ki67 and DAPI staining in Id4cKO mice after 5 days of tamoxifen administration. Ascl1 and Ki67 are frequently co-expressed in tdTomato+ RGLs, as indicated by the yellow arrows. Scale bar, 30 µm. (E) Quantification of the co-expression of Ascl1 and Ki67 in control and Id4cKO mice 5 days of tamoxifen administration. The fraction of tdTomato+ RGLs expressing both Ascl1 and Ki67 is 2.8 ± 1.9% in control mice and 6.3 ± 0.8% in Id4cKO mice. n = 2. (F) Quantification of the fraction of proliferating (Ki67+) tdTomato+ RGLs co-expressing Ascl1 in control and Id4cKO mice 5 days of tamoxifen administration. 34.1 ± 14.1% of Ki67+tdTomato+ RGLs also express Ascl1 in control mice, which increases to 54.4 ± 8.9% in Id4cKO mice, indicating that Ascl1 and Ki67 expression are highly correlated. n = 2. (G) Quantification of the number of tdTomato+ RGLs per mm3 in the DG of control, Id4Het and Id4cKO mice 5 days and 30 days after tamoxifen administration shows no change in overall stem cell number following Id4 deletion at either time-point. Significance determined using ordinary one-way ANOVA. For control mice, n = 4 at P65 and n = 5 at P90; n = 4 for P65 and n = 6 for P90 Id4Het mice; n = 5 for Id4cKO mice at P65 and P90. (H–I) Quantification of the fraction of Id1-positive and Id3-positive tdTomato+ RGLs in Id4cKO mice compared with control mice 5 days after Id4 deletion shows both are strongly increased, from 47.4 ± 7.3% to 88.0 ± 3.1% for Id1 and 11.24 ± 2.9% to 74.4 ± 2.1% for Id3. n = 3 for control and Id4cKO mice. (J–M) Single molecule RNA in situ hybridization (RNAscope) for Ascl1 RNA (magenta) along with immunostaining for GFAP and Id3 in P65 control mice shows that most Id3+ RGLS express Ascl1 (J, yellow arrow; quantified in L) and the vast majority of Id3+Ascl1+ cells in the SGZ co-express Id4 (K, yellow arrow; quantified in M). Scale bar, 30 µm. Panel three in (J) shows magnification of yellow box; scale bar 10 µm. n = pooled data from three mice. Error bars represent mean ± SEM. Significance values: ns, p>0.05; *, p<0.05; **, p<0.01; ***, p<0.001; ****, p<0.0001.