. 2019 Oct 22;8:e45465. doi: 10.7554/eLife.45465

Figure 6. In human cells Maritigrella crozieri xenopsin forms a functional photopigment that predominantly couples to Gαi pathways.

(A,B) HEK293 cells were transfected with Glo22F and indicated opsins, + /- pertussis toxin, and exposed to light. In B, cells were treated with 2 µM forskolin prior to the light flash. (C) HEK293 cells were transfected with mtAequorin and the opsins indicated, + /- pertussis toxin, and exposed to light. Plots show mean luminescence of technical replicates (from one representative of three biological replicates) normalized to the pre-flash timepoint, + /- SEM. Error bars smaller than symbols are not shown. n = 3 technical replicates in A,B; n = 4 technical replicates in C. The other biological replicates are shown in Figure 6—figure supplement 2.
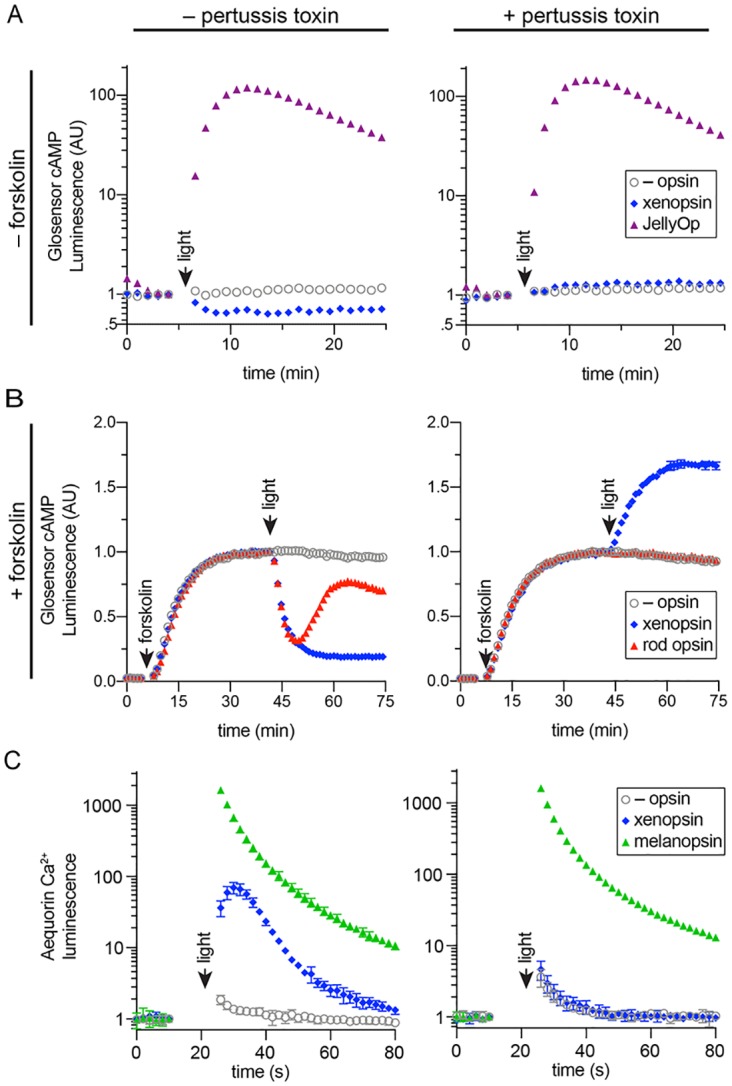
Figure 6.

Figure 6—figure supplement 1. Immunofluorescence to quantify opsin expression in HEK293 cells.
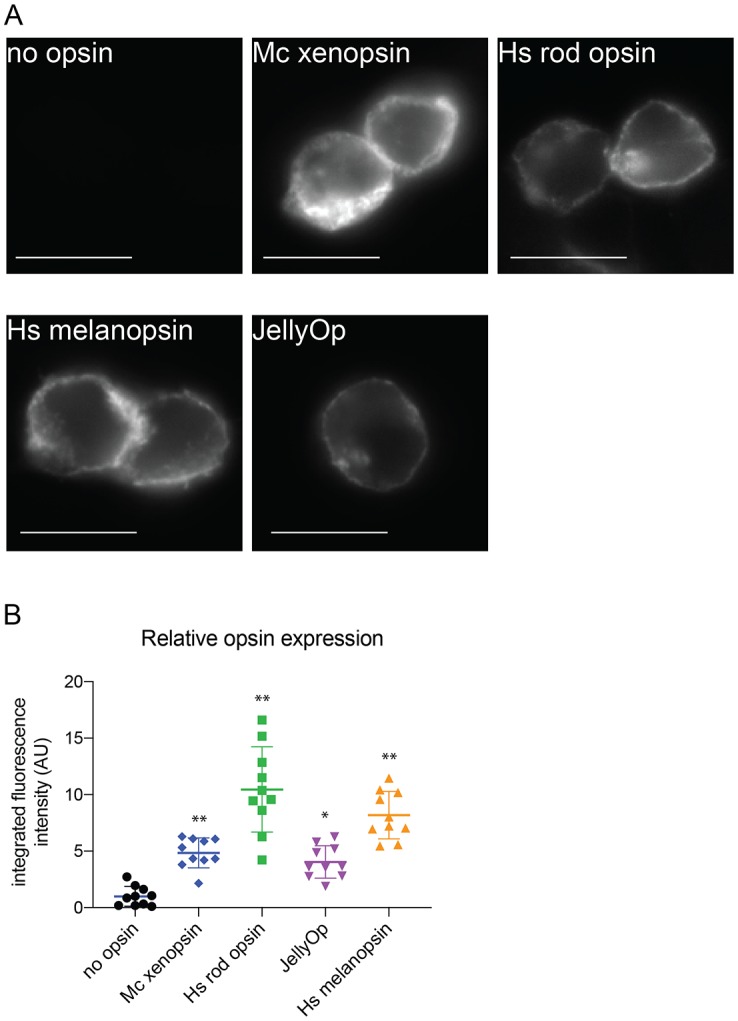
Figure 6—figure supplement 1.

Cells were transfected with opsins, fixed, stained with 1D4 anti-rod opsin antibody and fluorescent secondary antibody, and imaged on a fluorescent microscope. (A) Representative images of cells expressing each opsin and control (scale = 10 µm). (B) Quantification of integrated fluorescence intensity (minus background) for ten randomly selected fields from each sample, normalized to mean of no-opsin control, with mean and SEM. ANOVA and Dunnett’s multiple comparison test show significant differences between no opsin control and positive opsin conditions (*<0.05*, *<0.01). Mc xenopsin (Maritigrella crozieri xenopsin), Hs rod opsin (human rhodopsin), Hs melanopsin (Human melanopsin), JellyOp (Carybdea rastonii jellyfish opsin), SEM (standard error of the mean).
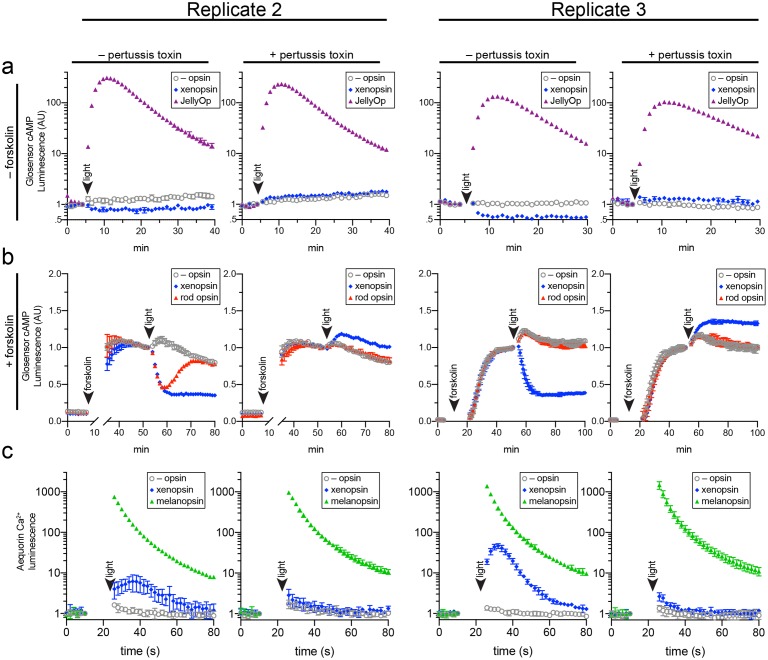
Figure 6—figure supplement 2. Two further biological replicates of the secondary messenger assays show there was quantitative variation from day to day in the magnitude of responses to light and forskolin, but the qualitative response of each opsin was consistent (excluding one replicate in which rod opsin showed no activity, possibly due to a faulty preparation of plasmid DNA).

Figure 6—figure supplement 2.