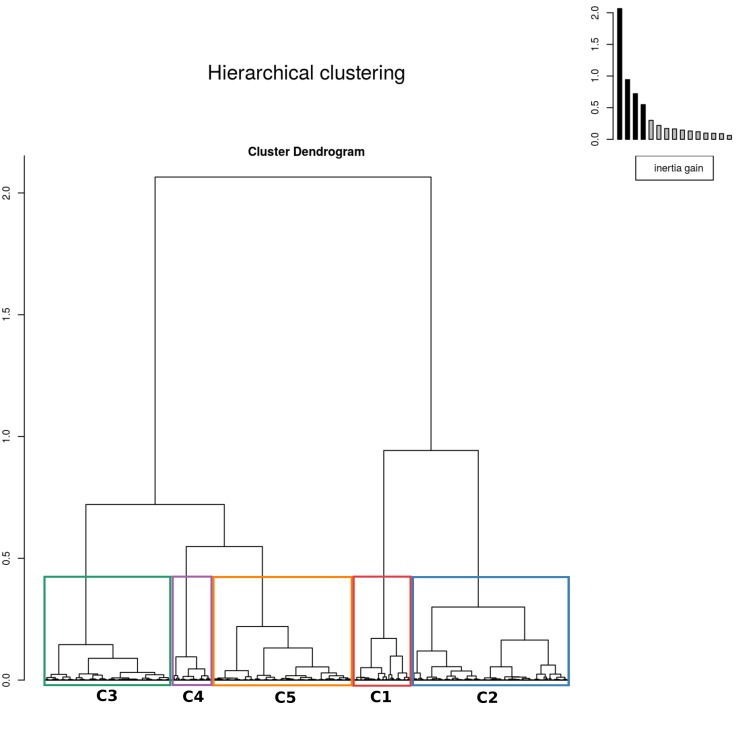
Appendix 1—figure 2. The results of hierarchical clustering on the principal component analysis.
The five clusters were identified by assessing the inertia (i.e. change in within cluster homogeneity) gained by cutting the tree at different levels and the ecological interpretability of the resulting clusters. The colors of the clusters correspond to those in Figure 10 in the main text.

