
Appendix 1—figure 3. Spatial patterns of human activity in Białowieża Forest derived from the publicly available world-wide data provided by STRAVA (https://www.strava.com/heatmap) combined with (A) predicted use of the landscape by the wolf, (B) predicted use of the landscape by the lynx, (C) predicted use of landscape by the red deer (both sexes) and (D) distance to major settlements used in the models for both large carnivores.
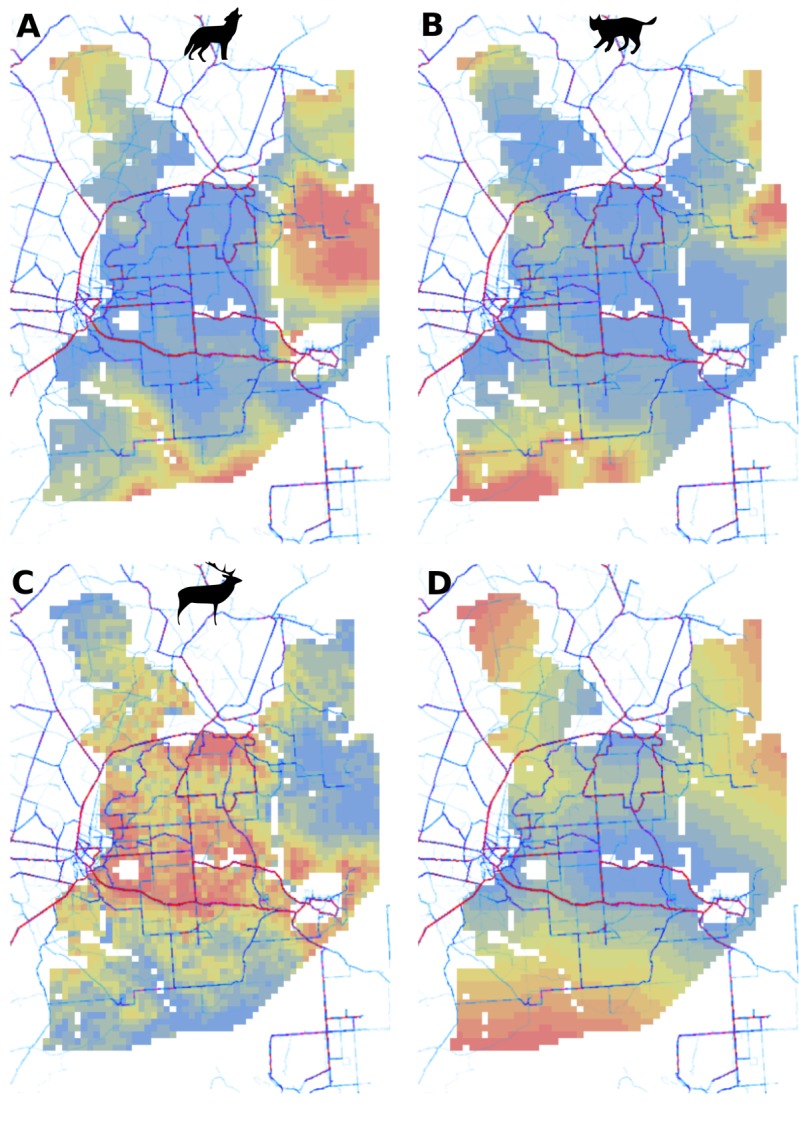
The dark-red thick lines indicate high human activity and the light-blue thin lines indicate low human activity. For (A), (B) and (C) the color gradient from blue to red corresponds to the gradient from low to high use of the landscape by the presented species.