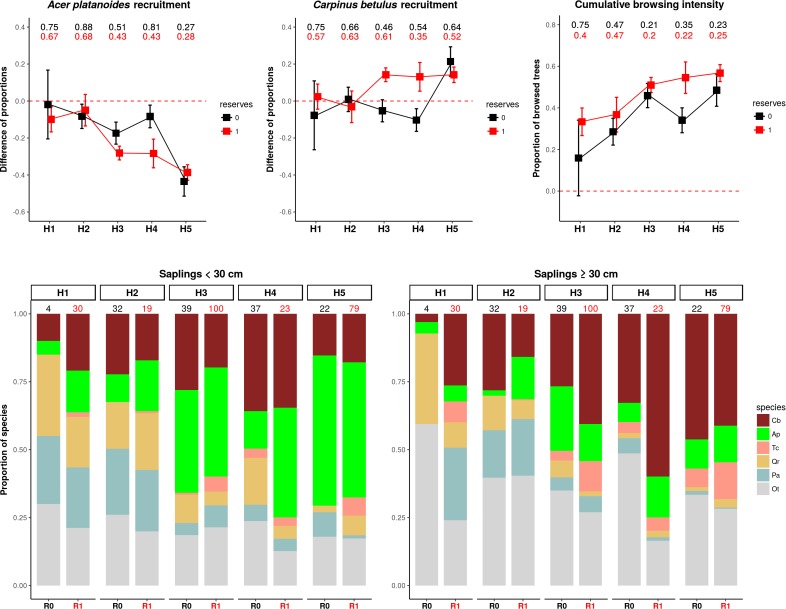
Figure 11. The patterns of browsing intensity and the composition of regenerating tree species differ between herbiscapes and between the protected and managed parts of the BF landscape.
(a, b) The mean differences between the two tree height classes (saplings < 30 cm and ≥30 cm) in the proportional shares of Acer platanoides (Acer) and Carpinus betulus (Carpinus). The numbers on top of both figures are the proportions of plots without a single individual of each species. (c) The cumulative browsing intensity index, expressed as the proportion of browsed individual trees out of all tree saplings ≥ 30 cm. The numbers on top of this figure are the proportions of plots with no browsing. Panels (a), (b) and (c) show the values predicted by the fitted linear models with two interacting factors: herbiscape (six levels) and reserves (two levels coded as 0: unprotected areas and 1: protected areas). The error bars are standard errors of the mean. (d) The mean proportions of selected tree species (saplings < 30 cm and ≥30 cm) out of the entire pool of the main regenerating trees recorded at the sampled plots, showed for the herbiscapes and protected (R1) and unprotected (R0) areas separately. The value on top of each stacked bar is the number of plots used to calculate the mean proportion. Cb: Carpinus betulus, Ap: Acer platanoides, Tc: Tilia cordata, Qr: Quercus robur, Pa: Picea abies, Ot: other species (Betula pendula, Sorbus aucuparia, Fraxinus excelsior, Alnus glutinosa, Populus tremula, Pinus sylvestris, Ulmus).

