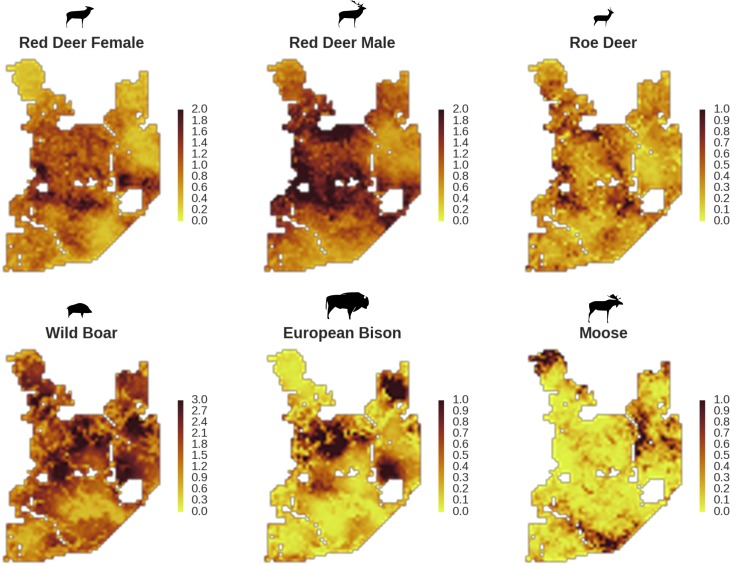
Figure 5. Only red deer (the major wolf prey) showed a negative spatial association with parts of the landscape intensively used by wolves, whereas distributions of other species were shaped by bottom-up factors.
The maps show substantial variation in predicted landscape use for the five studied ungulate species (relative density surfaces). Specifically, this figure presents the spatial predictions for the parameter which is the expected number of individuals using a given landscape grid cell (25 ha pixel) during the sampling period (see the general and formal description of the model in the Materials and methods section). The predictions are based on the parameter estimates presented in Figure 3 and include the spatial random effects (see Figure 4).

