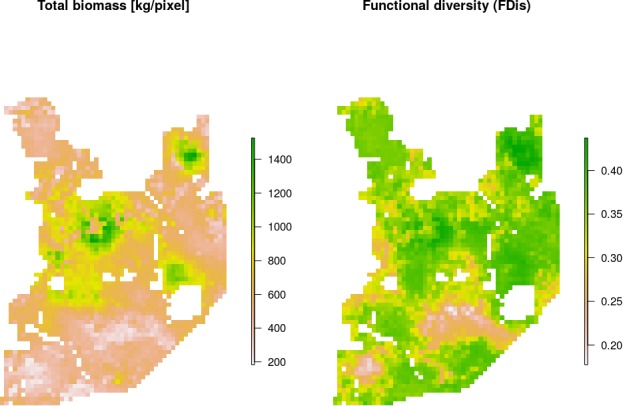
Figure 9. Maps of estimated total biomass [kg/pixel] and functional diversity (FDis).

Both variables, together with species-specific biomass raster layers, were used in the hierarchical clustering analysis. Interestingly, the lowest values of both parameters were largely associated with coniferous-dominated tree stands at higher elevations (compare with Figure 2), often re-planted after extensive clear-cuts from the past and belonging to the least productive parts of this landscape (Faliński and Falińska, 1986; Kwiatkowski, 1994).
