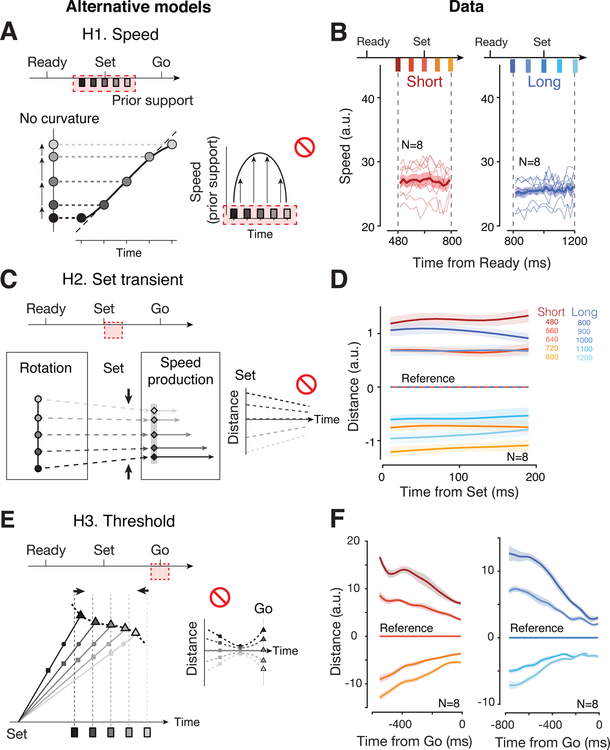
Figure 5. Alternative mechanisms.
(A) Speed model (H1). Top: Bayesian estimation during the support of the prior (shaded red) through modulation of speed. Bottom: If speed of neural trajectory is modulated according to an inverted U-shape (accelerating then decelerating; right), projections off of the trajectory would exhibit regression to the mean (gray dashed lines). (B) Instantaneous speed of neural trajectories during the estimation epoch for Short (red) and Long (blue) prior conditions computed in the full neural state space (thin lines: individual conditions for each animal; thick line: averages; shaded regions: s.e.m.) Speeds were relatively constant during the support of the prior and did not follow the pattern predicted by H1. (C) Transient model (H2). Top: Bayesian estimation through transient responses triggered by Set (shaded red). Bottom: The Set flash could pushes the system along slightly converging trajectories across ts causing regress to the mean. This predicts a reduction of distance between consecutive trajectories shortly after Set (right). (D) Distance between neural trajectories during the first 200 ms following Set. For each prior, we used the trajectory associated with the middle ts as reference (horizontal lines at y=0). For each time point along the reference trajectory, we computed the distance to the four other trajectories within each prior (shaded regions: s.e.m. across datasets). Trajectories were analyzed using PCA between Set and Set+200ms across the two prior conditions (>75% variance explained). Distance were relatively fixed and did not converge as predicted by H2. (E) Threshold model (H3). Top: Bayesian estimation through adjustment of threshold at the time of Go (shaded red). Bottom: If action-triggering states (curved dashed line) are biased such that faster trajectories (i.e., associated with shorter ts) have to travel longer distances to reach the threshold, threshold-crossing times (triangles) would exhibit regression to the mean even with unbiased speeds (left). This predicts a distinctive nonmonotonic organization of neural trajectories: distances between trajectories associated with different ts exhibit a large-small-large (squares-circles-triangles) pattern before the Go response (right). (F) Distance between neural trajectories aligned to the motor response. Similar to D, we used the middle trajectory as reference for the two prior conditions (left for Short, right for Long). Distances decreased monotonically and did not follow the distinctive pattern predicted by H3. Shaded area represents 95% confidence interval across conditions and animals. Distances were computed in the PC space obtained across ts and accounting for ~60% of the total variance; results remained unchanged when more PCs were included. See also Figure S5.

