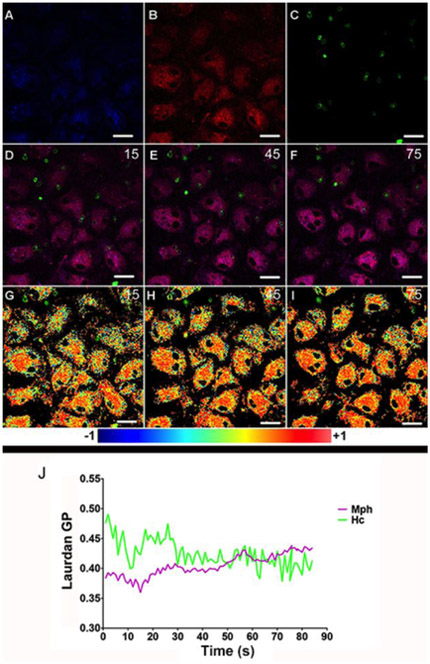
Figure 1 – Hc yeast cells induce dynamic changes of lateral organization in Mφ membranes.
Hc-Rho yeast cells were plated onto bone marrow-derived murine Mφs previously stained with Laurdan. Images A (channel 1: 440 nm, arbitrarily colored blue), B (channel 2: 490 nm, arbitrarily colored red) and C (channel 3: 595 nm, arbitrarily colored green) depict the first frame displaying the interaction of Hc yeasts and Mφ. Merge images of the three channels are shown in three distinct time frames (15, 45 and 90 s of interaction; D-F). GP images at the same time frames merged with Hc-Rho images showing the increase in lateral organization over the time of interaction (G-I). GP values over this time course are depicted in panel J where the purple line represents average GP values of Mφ membranes and the green line represents the average GP specifically at the Hc-Mφ contact regions. Statistics were performed for (i) all frames, (ii) the first and last 10 minutes and for the (iii) three set of frames (30, 60 and 90). Representative of three independent experiments, differences considered significant by unpaired t-test. For all analyses p<0.001 (see details in Supplementary Table 2). Bar, 10 μm.

