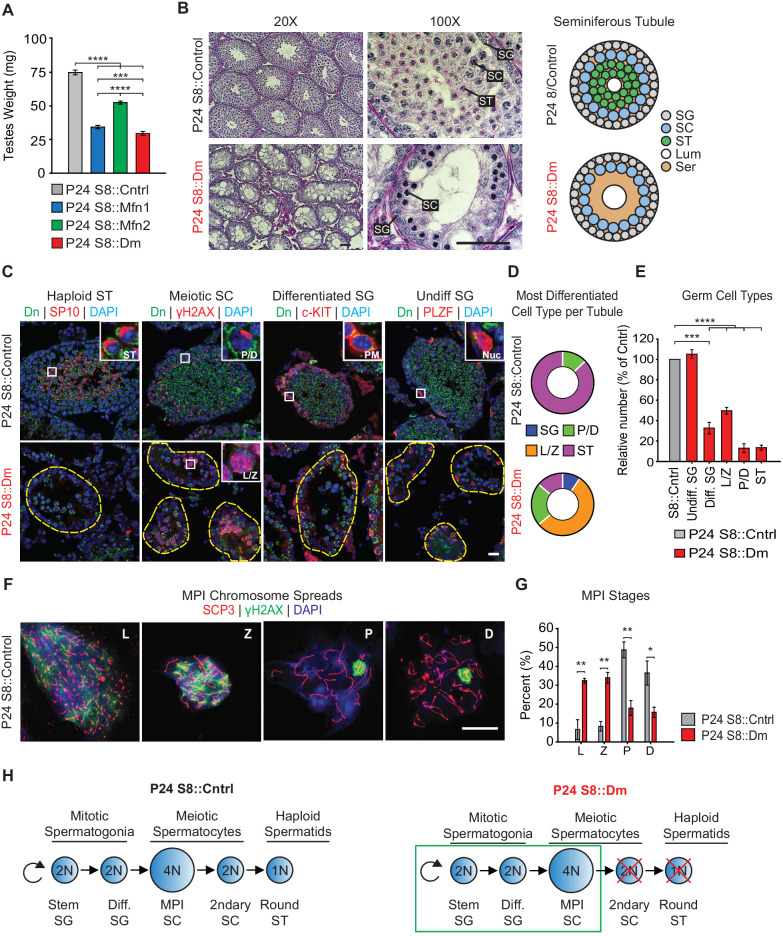
Figure 2. Mitofusins are required for meiosis.
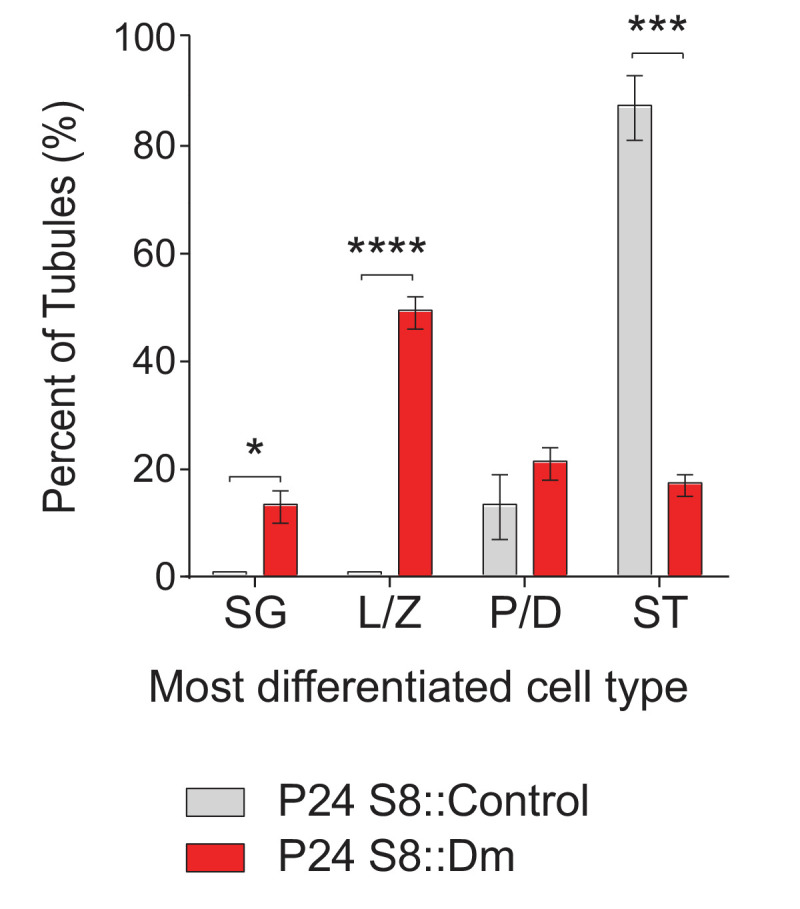
(A) Testes weight measurements from juvenile P24 mice. N ≥ 3. (B) Periodic Acid-Schiff (PAS) histology testis sections. Note the absence of post-meiotic spermatids in S8::Dm tubules. Scale bars, 50 µm. On the right are stylized depictions of the 100X panels. SG, spermatogonium; SC, spermatocyte; ST, spermatid, Lum, lumen; Ser, Sertoli cell cytoplasm. (C) Analysis of the major germ cell types in WT and mutant testis sections. For clarity, the borders of mutant seminiferous tubules are outlined by dashed lines. The markers used are indicated. Scale bar, 20 µm. Dn, mito-Dendra2. (D) Doughnut graphs tabulating the most differentiated cell type found in seminiferous tubule cross sections. For p-values, see Figure 2—figure supplement 1, which shows the same data displayed as bar charts. N = 4. (E) Quantification of germ cells in seminiferous tubule cross sections. Mutant values are plotted relative to control, which is set at 100% and indicated by the gray bar. There is an upward trend from differentiated spermatogonia to the leptotene/zygotene stage, but this difference was not statistically significant. N = 4. (F) Representative images of chromosomal spreads from WT spermatocytes in meiotic prophase I (MPI). Mutant meiotic spreads had no obvious chromosomal abnormalities. Scale bar, 20 µm. (G) Quantification of MPI substages from chromosomal spreads. In the mutant, note the bottleneck at the zygotene-to-pachytene transition. N = 4. (H) Schematic of normal spermatogenesis (left), and the meiotic defect in mutants (right). ST, spermatid; MPI, Meiotic Prophase I; SC, spermatocyte; P/D, pachytene/diplotene; L/Z, leptotene/zygotene; SG, spermatogonium. All data are from P24 juvenile mice. Data are represented as mean ± SEM. ****p≤0.0001; ***p≤0.001; **p≤0.01; *p≤0.05. For statistical tests used, see the Materials and methods section.
Figure 2—figure supplement 1. Same data as in Figure 2D but displayed as bar charts to indicate.

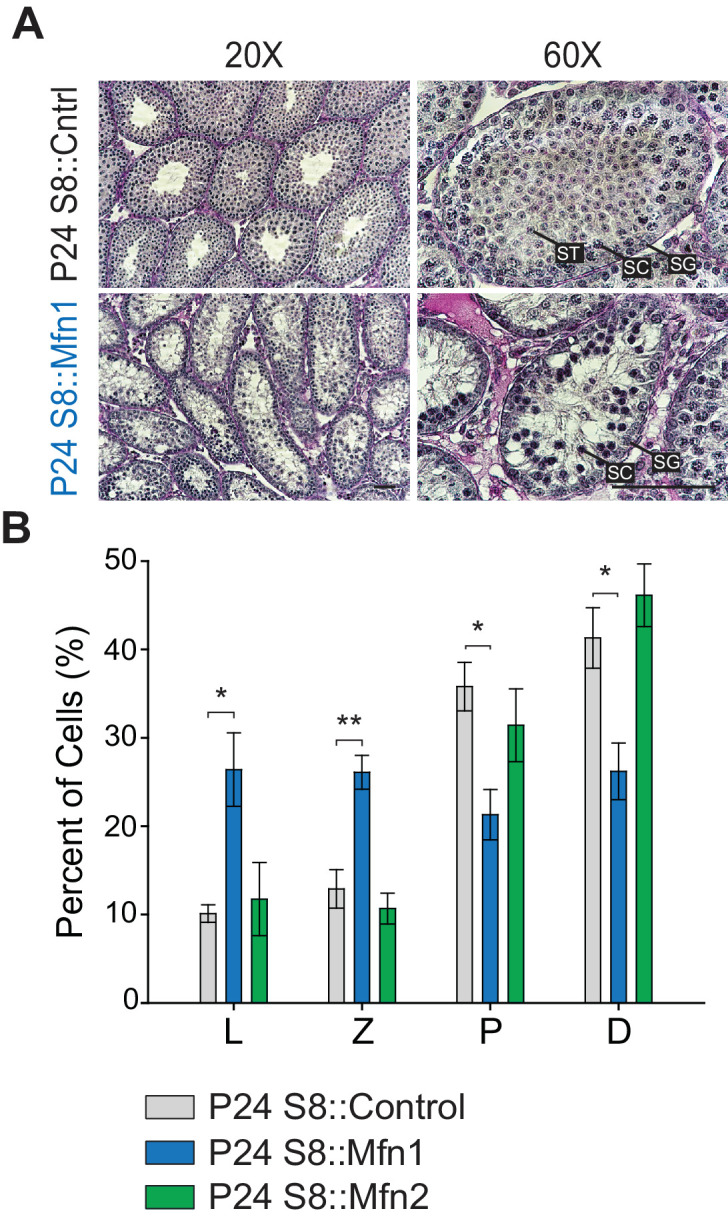
Figure 2—figure supplement 2. Mfn1, but not Mfn2, is required for meiosis.


