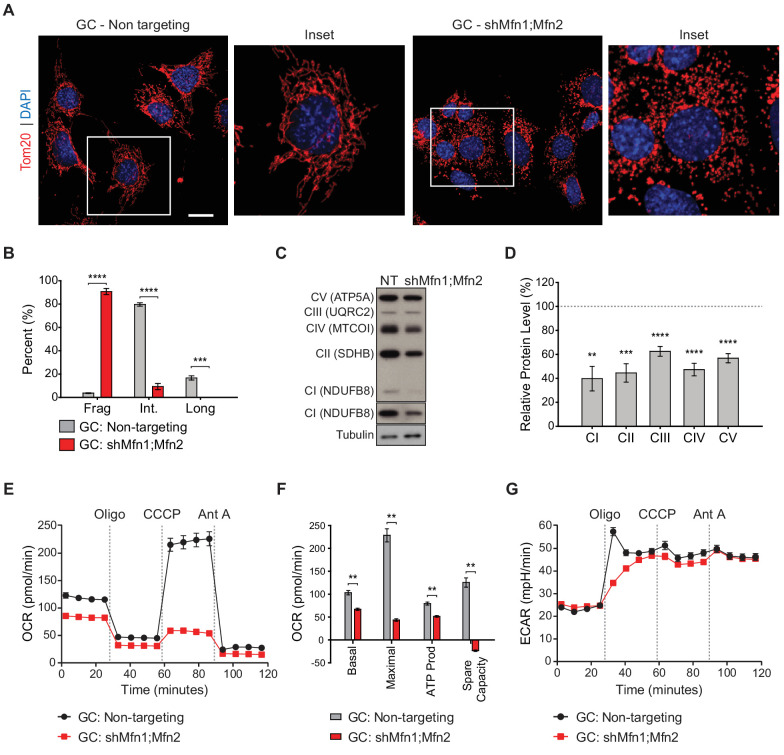
Figure 7. Mitofusin-deficient immortalized spermatocytes have reduced OXPHOS subunits and activity.
(A) Immunostaining against the mitochondrial outer membrane marker, Tom20 in an immortalized spermatocyte cell line, GC-2Spd(ts) (GC). Note the mitochondrial fragmentation in shMfn1;Mfn2 treated cells compared to the non-targeting control. Scale bar, 20 µm. (B) Quantification of mitochondrial morphology in GCs. Mean values from three replicates are plotted. (C) Western blots showing various respiratory chain complexes in GCs. NT, non-targeting. (D) Densitometry analysis of western blots. Mean values from four replicates are plotted. (E) Oxygen Consumption Rate (OCR) measurements in GCs. (F) Quantification from E. (G) Extracellular Acidification Rate (ECAR) measurements in GCs. Oligo, oligomycin; CCCP, carbonyl cyanide m-chlorophenyl hydrazine; Ant A, antimycin A. Data are represented as mean ± SEM. ****p≤0.0001; ***p≤0.001; **p≤0.01. For statistical tests used, see the Materials and methods section.
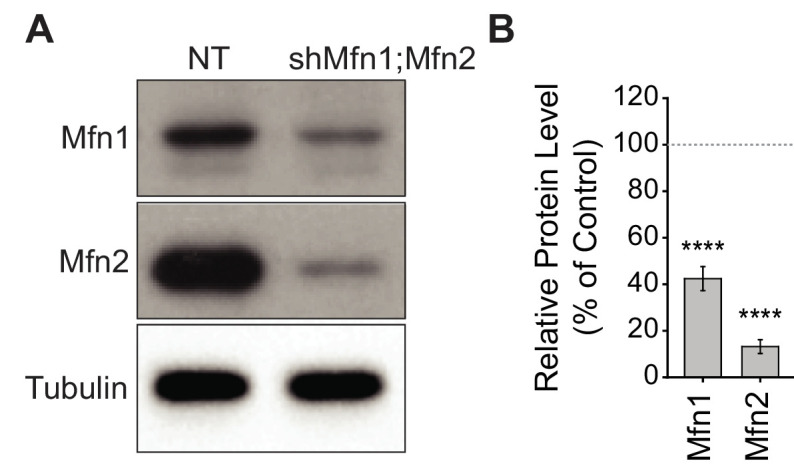
Figure 7—figure supplement 1. Mitofusin knockdown in immortalized spermatocytes.

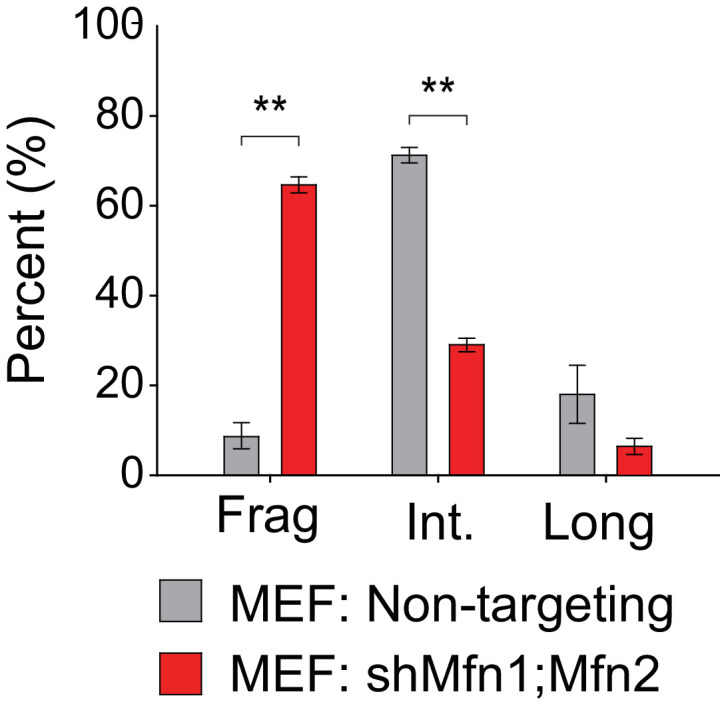
Figure 7—figure supplement 2. Quantification of mitochondrial morphology in MEFs.

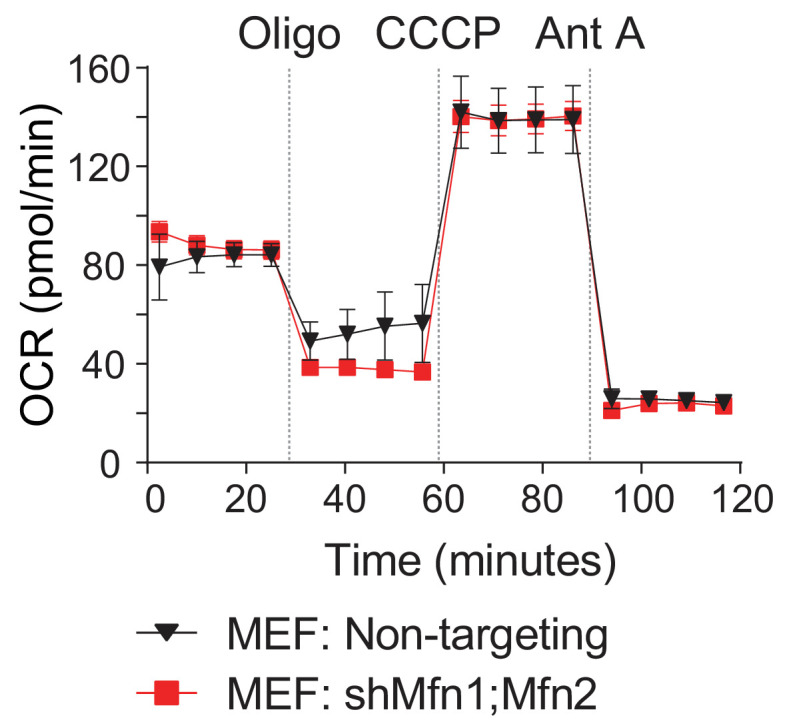
Figure 7—figure supplement 3. Oxygen Consumption Rate.


