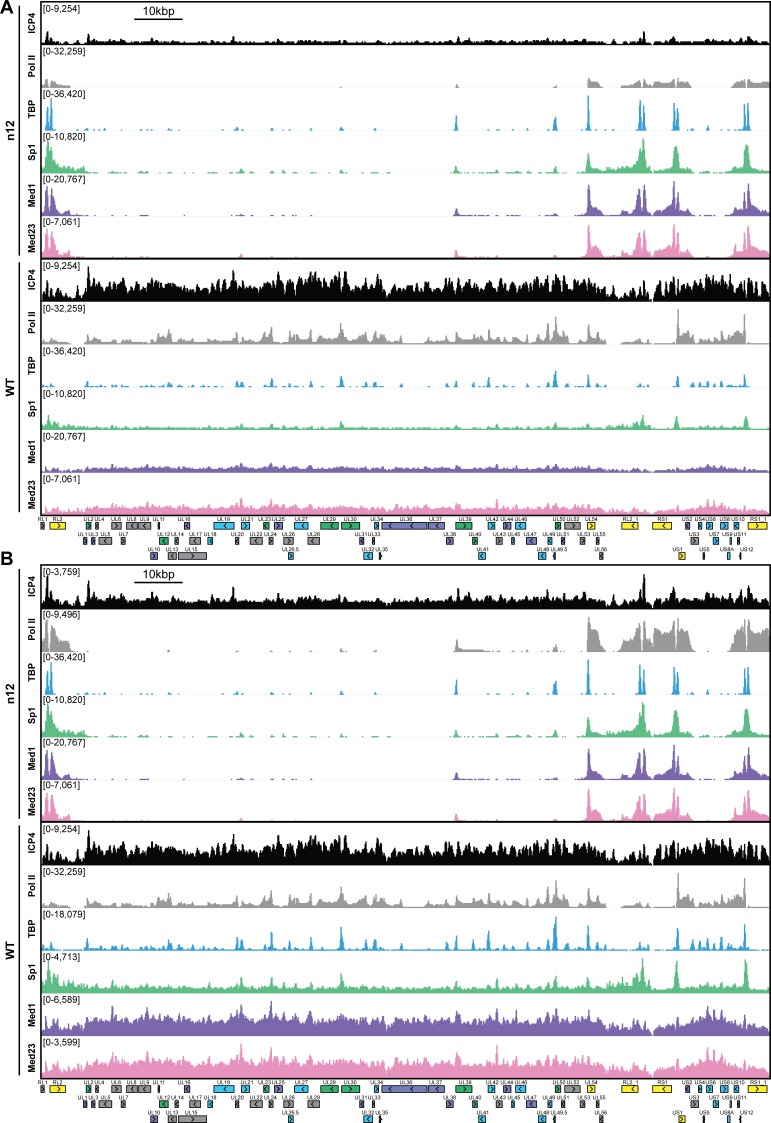
Figure 2. ICP4 recruitment of host Pol II machinery to viral promoters.
MRC5 cells were infected with an ICP4 null mutant (n12) or HSV-1 (WT) for 2.5 h and ChIP-Seq for ICP4, Pol II, TBP, Sp1, Med1, and Med23 was performed. All data was normalized for sequencing depth and viral genome number using input ChIP-Seq reads. Viral ORFs are indicated, color coded by gene class with IE as yellow, E as green, leaky late (L1) as blue, and true late (L2) as purple. (A) Fold change of n12 over WT aligned to the viral genome. Loci with greater binding in n12 or WT are colored in green or red, respectively. (B) ChIP-Seq reads normalized per viral genome and aligned to canonical IE, E, and L1 genes.


