. 2019 Oct 22;8:e51109. doi: 10.7554/eLife.51109

Figure 3. ICP4 dependence of viral genome accessibility and Histone H3 binding.

MRC5 cells were infected with an ICP4 null mutant (n12) or HSV-1 (WT) and harvested prior to genome replication. (A) ChIP-Seq for ICP4, Pol II, H3 and B–D) ATAC-Seq was performed. All data was normalized for sequencing depth and viral genome number using input ChIP-Seq reads. (C) Quantitative analysis of ATAC-Seq data, measuring the relative tagmentation enrichment for the virus or host as compared to expected. (D) Histogram plot of ATAC-Seq fragment size for reads mapped to the viral (red) or cellular (black) genome. Mononucleosome protected fragments are approximately 180–250 bp.

Figure 3.

Figure 3—figure supplement 1. Analysis of ChIP-Seq data quality.

Figure 3—figure supplement 1.

Normalized viral aligned bigwig files were assessed using MultiBigwigSummary in 50 bp bins. The values within these bins were plotted for biological replicates and a linear regression analysis was performed.
Figure 3—figure supplement 2. Analysis of ChIP-Seq data quality.

Figure 3—figure supplement 2.

Normalized cellular aligned bigwig files were assessed using MultiBigwigSummary in 10,000 bp bins. The values within these bins were plotted for biological replicates and a linear regression analysis was performed.
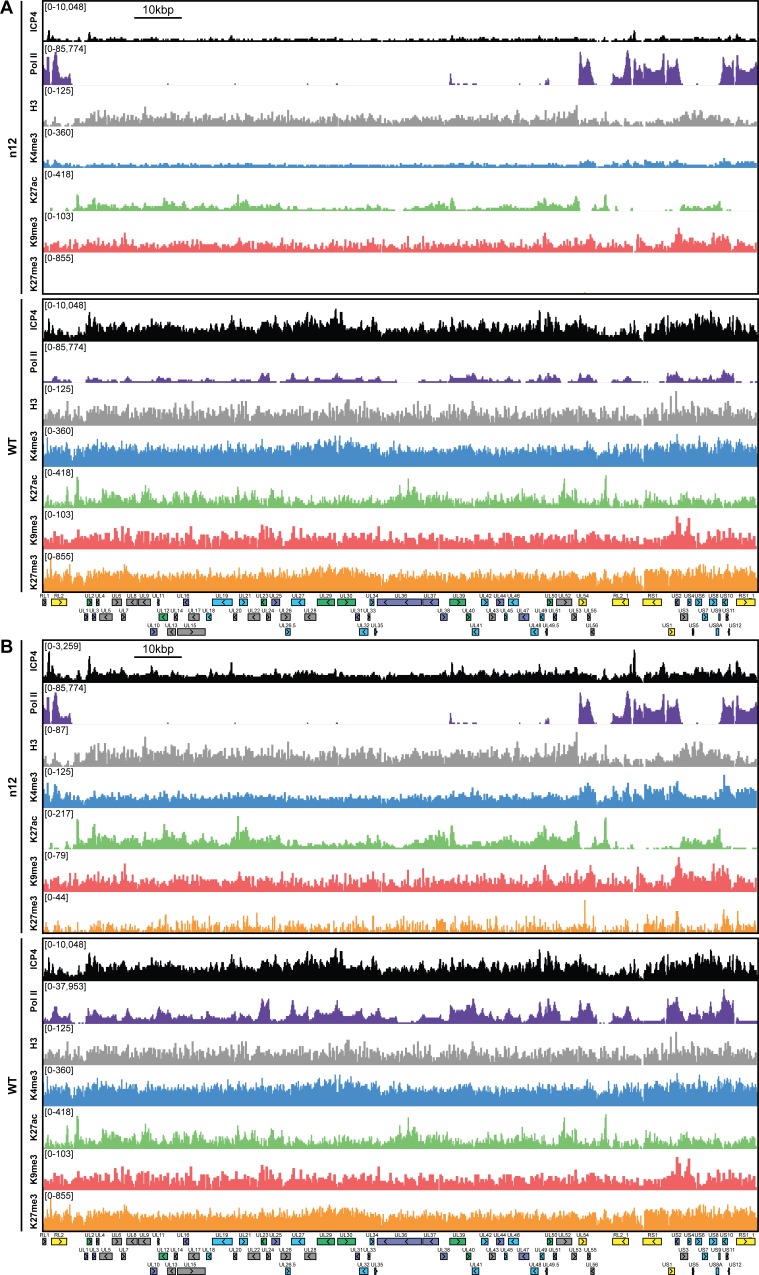
Figure 3—figure supplement 3. MRC5 cells were infected with an ICP4 null mutant (n12) or HSV-1 (WT) for 2 hr and ChIP-Seq for ICP4, Pol II, H3, H3K4me3, H3K27acetyl, H3K9me3, and H3K27me3 was performed.

Figure 3—figure supplement 3.

All data was normalized for sequencing depth and viral genome number using input ChIP-Seq reads. Viral ORFs are indicated, color coded by gene class with IE as yellow, E as green, L1 as blue, and L2 as purple. y-axes were (A) maintained the same between IP’s or (B) maximized for each trace to aid in visualization.