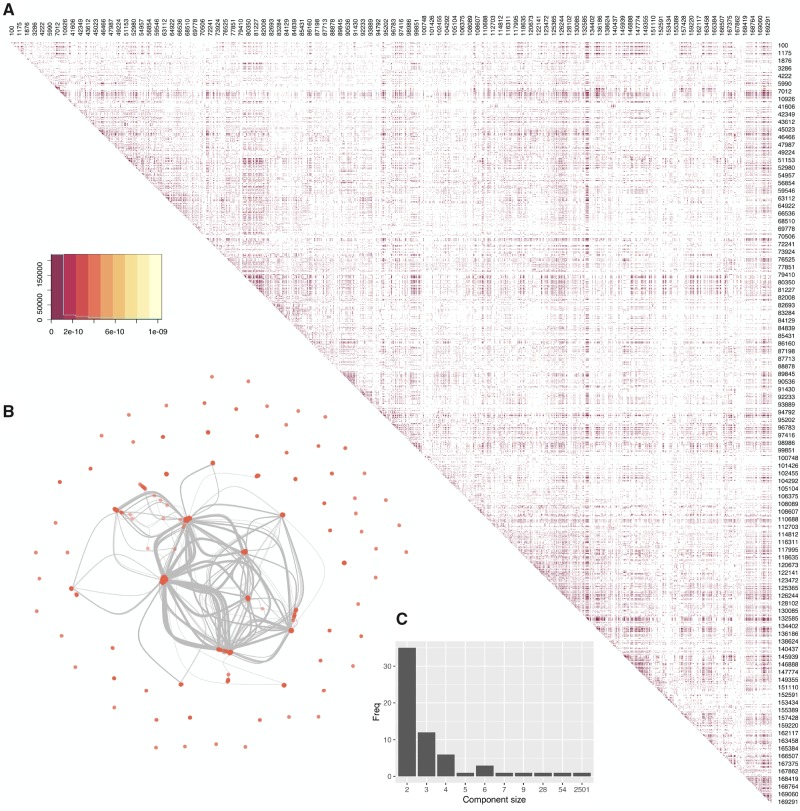
Fig. 1.
(A) Heatmap of SNPs which are in significant LD. Darker colors indicate lower P values, with insignificant pairs being colors white. Numbers denote the genome positions (sampled uniformly), with rows and columns that did not contain any significant pair of SNPs in LD removed. (B) Association network of all sites in LD with at least one other site. Each node represents a biallelic site, each link between two nodes signifies they are in LD with each other. (C) Frequency plot of all connected components in the association network.

