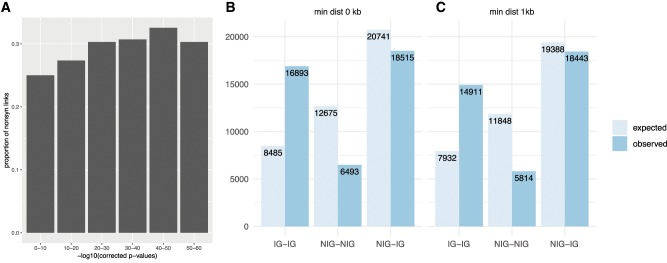
Fig. 3.
(A) Proportion of pairs of nonsynonymous sites in LD with each other over LD strength. (B–C) Number of links between nonsynonymous sites between different categories of genes. (B) All sites (chi-square test, P < 2.2e-16). (C) Sites with a minimal distance of 1 kb (chi-square test, P < 2.2e-16).

